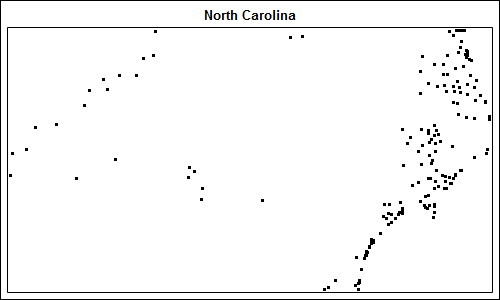
Simple maps can go a long way
Charlie Huang recently posted an article on a new way to draw maps using SGPlot procedure. The basic idea is simple, just use the SCATTER statement to plot the (x, y) points from the data sets in the MAPS library. The GROUP option can be used to color the markers for each
