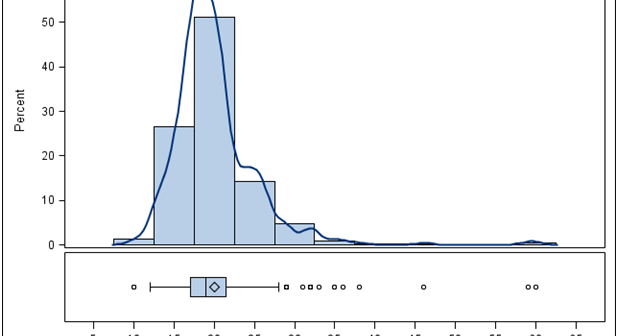
High resolution graphs
Creating a graph that looks nice, with readable, high resolution fonts is important and should be easy to do. With SG procedures and GTL, this is easy to do with a simple option, but not the default. Creating a high resolution (image) for a graph consumes higher system resources. When working on a graph,
