The Unicode character table contains a vast array of characters and symbols that can be quite useful for making your text more descriptive in your graph. These characters can be inserted into any viewable string that you can define in the GTL or SG procedure syntax. These strings include titles, footnotes, axis labels, legend labels, and inset text. However, input data values may not use the following technique to add these characters.
The Unicode characters are inlined in the string using the ODS ESCAPECHAR syntax. The default escape sequence is (*ESC*); however, you can redefine the escape character by using the ODS ESCAPECHAR statement:
ods escapechar='~';
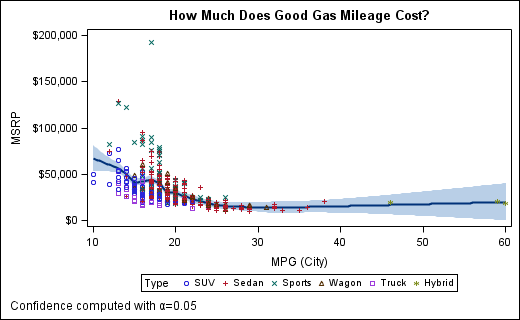
In the following example, the alpha character is used in the FOOTNOTE statement. Notice that the keyword ALPHA is used instead of the Unicode value for alpha. In the ODS Graphics system, we have predefined keywords for a number of commonly-used Unicode characters, including Greek characters and certain diacritical marks (bar, bar2, hat, tilde, and prime).

ods escapechar='~';
Title "How Much Does Good Gas Mileage Cost?";
Footnote j=l "Confidence computed with ~{unicode alpha}=0.05";
proc sgplot data=sashelp.cars;
   loess x=mpg_city y=msrp / nomarkers clm alpha=.05;
   scatter x=mpg_city y=msrp / group=type;
run;
Not all Unicode fonts are created alike. Fonts like “Arial” are Unicode-compliant with their character mapping, but they do not contain the full Unicode specification. Choosing a fully-defined Unicode font becomes important when trying to reference more exotic characters such as diacritical marks and superscript/subscript characters. If the fonts you are using does not support the requested Unicode character, the character will simply be drawn as a box in the graph.
Your system could already have some fully-Unicode fonts. For example, “Arial Unicode MS” contains a much larger number of the Unicode characters using an Arial-style font. However, SAS ships a number of Unicode fonts that you can use when specifying more exotic Unicode characters. A full Unicode font is needed for the following example that uses subscripts.
ods escapechar='~';
Title "Random Data from Two Study Groups";
proc sgplot data=random;
   xaxis type=log minor label="log~{unicode '2081'x}~{unicode '2080'x}x"
         labelattrs=GraphUnicodeText;
   yaxis type=log minor label="log~{unicode '2081'x}~{unicode '2080'x}y"
         labelattrs=GraphUnicodeText;
   scatter x=x y=y / group=g;
run;
In this example, the “1” and “0” Unicode subscripts are chained together to create a “10” for the log base. There are a number of other Unicode superscript/subscript characters that can be combined to create more elaborate expressions. Notice that the LABELATTRS option references a style element called “GraphUnicodeText”. This element references one of SAS’s shipped Unicode fonts that should correctly render more exotic characters (the font will be serif or san-serif, depending on the style used). You can also specify your own font directly, such as “Arial Unicode MS”. The ability to set font attributes directly in the procedure syntax was added in SAS 9.3; however, this is something you can do in GTL since it’s production release in SAS 9.2.
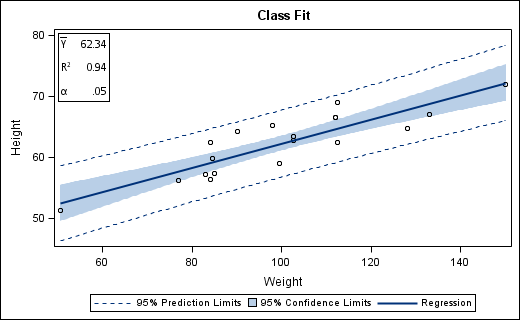
Another place where Unicode, superscript, and subscript come in handy is for insetting information into your graph. In addition to the Unicode function describe above, the INSET statement in SGPLOT also supports the SUP and SUB function directly without having to change to a full Unicode font. In addition, there is additional logic in the procedure that will switch the font to the one in GraphUnicodeText if you use one of the predefined diacritical mark keywords. In the following example, the BAR over the Y triggers the procedure to use the Unicode font.
ods escapechar='~';
Title "Class Fit";
proc sgplot data=sashelp.class;
    reg x=weight y=height / clm cli;
    inset ( "Y~{unicode bar}"="62.34" "R~{sup '2'}"="0.94"
            "~{unicode alpha}"=".05" ) /  position=TopLeft border;
run;


12 Comments
To make your life easier, you can define a macro to hide the complexities. For example,
%let LOG10 log~{unicode '2081'x}~{unicode '2080'x};
...
XAXIS label="&LOG10.x" ...
Pingback: SGPLOT with axis-aligned statistics columns - Graphically Speaking
Pingback: Construct the equation of a line: An exercise in string concatenation - The DO Loop
Pingback: Adding Harvey Balls to your SAS reports - The SAS Dummy
Hi Rick,
I tried to use "Estimated GFR [mL/min/1.73m~{sup '2'}]" in a label in a HIGHLOWPLOT
statement in GTL, but it didn't resolve - came out as verbatim text.
Yours,
David
In SGPLOT, SUP and SUP can be used only in an INSET statement; however, UNICODE can be used in any string.
Hi Dan,
I have a quick question. is there any way we can change the color by using unicode? for example, you mentioned about changing alpha as a symbol, is there anyway i could show alpha is in red?
thanks,
maggie
The Unicode values are codes that reference glyphs in a font. The color for those glyphs must be controlled separately with statement syntax. In the example using the ALPHA character in the FOOTNOTE statement, you can use the standard FOOTNOTE syntax to color the ALPHA red. Depending on where the Unicode value is used in the procedure syntax, you can use corresponding "ATTR" bundles to control the visual attributes of the text, including color.
Hi Dan,
For a title in GPLOT, I have to set the 13 in "13C-recovery", as a superscript.
I already managed to do the same with "2", being : (*ESC*){unicode '00b2'x}, but with the number 13 I do not know which unicode to apply.
Thank you!
Sincerely yours,
Charlotte
To get "13" as a superscript, you will need to add each digit separately. In you case, try the following:
"(*ESC*){unicode '00b9'x}(*ESC*){unicode '00b3'x}C-recovery". Let me know if that works okay for you.
Pingback: How to work with emojis in SAS - The SAS Dummy
Pingback: Adding Harvey Balls to your SAS reports - The SAS Dummy