 Note: Following is an eight-part serialization of selected content from Steve Morlidge's The Little (Illustrated) Book of Operational Forecasting.
Data Series are different – and it matters to forecasters
The nature of demand that is to be forecast, as represented by patterns in the historic data series, that is to be forecast is the most important consideration for the forecasting practitioner.
Because operational forecasts are used to help businesses respond to demand, they have to be made at the level of demand, i.e. by individual end product (typically SKU) and stock holding location.
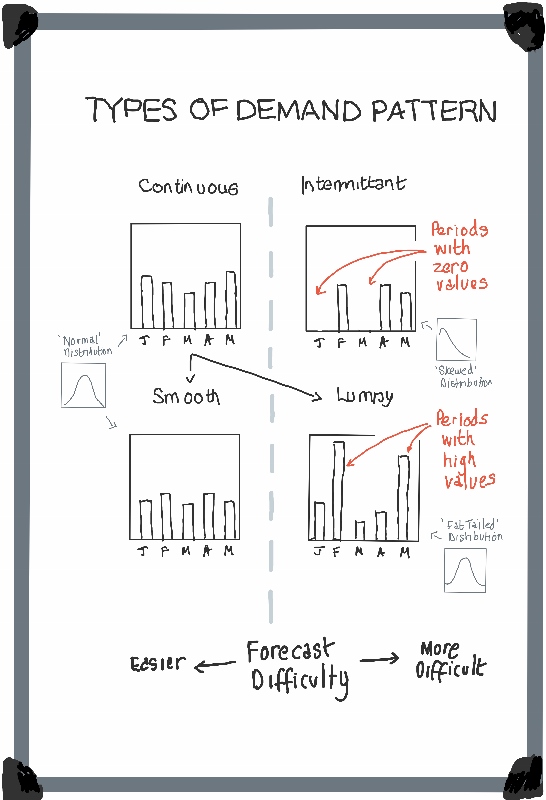
The data series concerned may be continuous – i.e. with a value in every period - and be relatively easy to forecast, particularly if there is not too much change from one period to the next. But at the detailed level at which forecasts are made simple patterns like this may not be the norm.
Sometimes a data series is continuous but has periods with exceptionally high values, and so looks very ‘lumpy’. As it is often difficult to forecast when these spikes will occur and how big they will be, forecasters can often do no better than estimate a range of potential values for these spikes.
At the extreme, intermittent data series have a large number of periods with zero values. These are even more difficult to forecast as there is often no way of knowing whether any particular period will have a zero value or not. So, the best that a forecaster can do is to estimate a good average.
TAKE OUT
Make sure that you understand the characteristics of the data series that you are attempting to forecast. They can be continuous or intermittent; smooth or lumpy.
Coming Next: The forecasting challenge
The mathematical nature of much operational forecasting can seduce people into thinking that the key to success lies in mathematical sophistication. This lesson explains why this naïve faith is misplaced.

