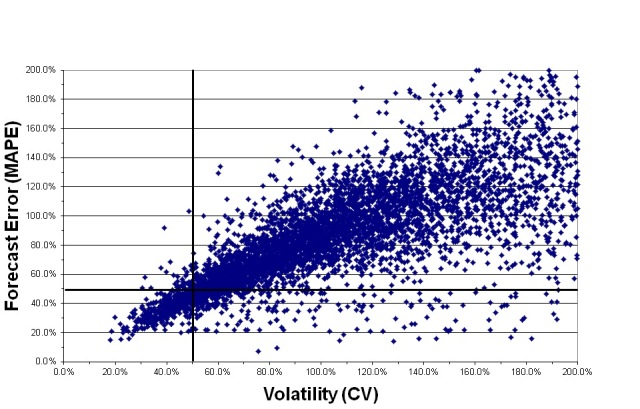
 In this second of three flash reports from last week's Analytics2011 conference, we hear about a favorite topic of mine -- the relationship between demand volatility and forecastability.
Rob Miller of Avantor Performance Materials, on Forecastability and Demand Volatility
The "comet chart," illustrating the relationship between demand volatility and forecast error, has been one of my favorite diagnostic devices for years. In Rob Miller's version, utilizing 36 months of data for over 6000 items, he found that 87% of items fell in the upper right hand quadrant (with both MAPE and CV above 50%), and only 5% of items had CV < 50%.
When he took the job in forecasting, Rob's management told him they have very bad errors. Everyone had an opinion on the source of the problem, but no data to back it up. Rob began an extensive analysis of the demand patterns, looking at such factors as order frequency, number of customers per item, and average demand per item. He found, for example, that only 23% of skus were ordered every month of the year, and 25% of skus were ordered in 3 or fewer months of the year. When he went to customer/sku level, 87% of skus were ordered in 3 or fewer months of the year.
What Rob discovered, and then had to demonstrate to management, was that their problem wasn't forecasting, it was forecastability. With all the low volume and high volatility products they sold, there was little hope of ever achieving accurate forecasts. Using Forecast Value Added analysis, Rob showed that their forecasting process is adding value -- they are able to reduce forecast error by over 10 percentage points compared to a naive model. But the surest way to get better forecasts would be to reduce the volatility of demand patterns. They could also avoid the forecasting problem by making low volume / volatile items Make-to-Order rather than Make-to-Stock.
If you are still being challenged on forecast accuracy by your management, consider some of the analyses that Rob conducted. How forecastable are your demand patterns? Is your forecasting process adding value by beating a naive model? Are there things you can do (changing sales and marketing practices, for example) to reduce the volatility in your demand patterns? Or something I will propose: Using sku rationalization to prune the extremely low volume products.
If all else fails, try a clever argument proposed by someone in Rob's audience. Compare the volatility of what you are trying to forecast to the volatility of the stock market. You will probably find that your volatility is much worse. Then ask your management: If nobody can accurately forecast the stock market, how much chance do we have of accurately forecasting our own (much more volatile) demand patterns?


2 Comments
Comparing SKU volatility to the stock market is genius.
I ran the numbers based on the monthly close of the S&P500 and the COVs the last few years were:
2005=0.024
2006=0.040
2007=0.030
2008=0.155
2009=0.130
2010=0.059
2011=0.054
When we run the same analysis on GLD, which represents the price of Gold, the highest COV value from the last few years is 0.095 (from 2011 so far). I wish we had SKUs as predictable as that.
Pingback: Flash3: Report from Analytics2011 in Orlando - The Business Forecasting Deal