In this guest blog, my colleague Snurre Jensen (Analytic Solutions Manager, SAS EMEA Technology Practice) discusses a fine point regarding the word “seasonality” in time series forecasting.
When we see general ups and downs in the data that tend to repeat year after year, we commonly refer to this as seasonality. Thus, we would say that there is seasonality in the sale of snow shovels, as there are generally higher sales in the winter, and lower sales in the summer.
Snurre points out that in the construction of statistical forecasting models, seasonality refers to repeating behavior in the same specific period year after year. So while generally, snow shovel sales are higher in the winter and lower in the summer, we might build our statistical forecasting models in weekly time buckets (not in quarterly spring / summer / fall / winter buckets). We don’t necessarily expect that there is a perfect match between the specific weeks, year over year, where snow shovel sales are higher or lower. In the construction of time series forecasting models, however, the concept of seasonality applies to consistent behavior in the specific time bucket (day, week, month, quarter, etc.) in which you are forecasting.
Let’s let Snurre explain…
Cyclicity
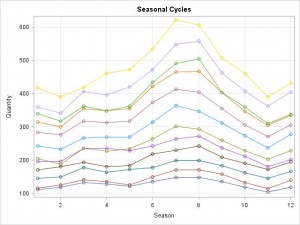
 A couple of weeks ago I was visiting a customer where once again I found myself involved in a discussion on how to deal with seasonality when forecasting. Unfortunately not all data with a seasonal pattern behave as nicely as the data in the graph below. Here it is evident that the seasonal cycles very neatly mirror each other, every month, year after year.
Now, during my years working with forecasting I've come across many thoughts on what seasonality means and how to deal with it. If there is any way of summarizing my experiences it would be something like this:
- Seasonal items refer to items (or services) that are only sold during a certain time of the year ("the season"). An example could be items that belong to a specific holiday - for instance Christmas. Outside the seasonal period the item is not produced, stocked and sold.
- Seasonal items are items that are sold all the time but where the level changes during "the season"
- Seasonal items are items that are sold all the time but where the level changes during specific periods each year.
Whereas #1 can more or less easily be dealt with using techniques like time series compression - the main difficulty lies in deciding when "the season" starts and when it ends - #2 and #3 requires some additional thought. To the casual observer (read business user) bullet #2 and #3 might seem identical - isn't "the season" the same specific periods year after year? Yes and no, and this is where it gets tricky.
In my experience confusion around #2 and #3 arises when one wants to do forecasting where the data is measured at a frequency where the individual time periods are not comparable across periods. This is the case for weekly data on a yearly basis and daily data on both a monthly and a yearly basis. Week X of one year may not be comparable to week X of the prior year -- for examples holidays often fall in different weeks in different years. Today, September 13th, is different from September 13th last year (for among other things, they fall on different days of the week). The same applies for daily data within a month -- the 2nd of this month is most likely different from the 2nd of last month (different days of the week, adjacent to different holidays, etc.).
Comparing this to quarters and months in year, days in a week and hours in day this seems to indicate that people have challenges with numbers larger than 25. :) If there are more than 25 periods in a season the concept of seasonality apparently becomes blurry.
In Part 2, we'll look at an example of a weekly time series, and how our everyday concept of "seasonality" differs from the precise use of this word in forecast modeling.


1 Comment
Pingback: Guest blogger: Snurre Jensen on seasonality vs. cyclicity (part 2 of 2) - The Business Forecasting Deal