Excitement levels are high for the March 2020 release of SAS Customer Intelligence 360, which includes multiple years of research and development culminating in enhancements to the platform's underlying data model. The changes will introduce the unification of a comprehensive data model recording both:
- Customer behavior -- what users are doing, such as viewing pages, opening apps and meeting goals.
- Customer interactions -- what users do when presented a task (i.e. web, mobile or email interactions) or activity, such as impressions and conversions across a series of interactions.
If you love data related to customer journeys, this is big!
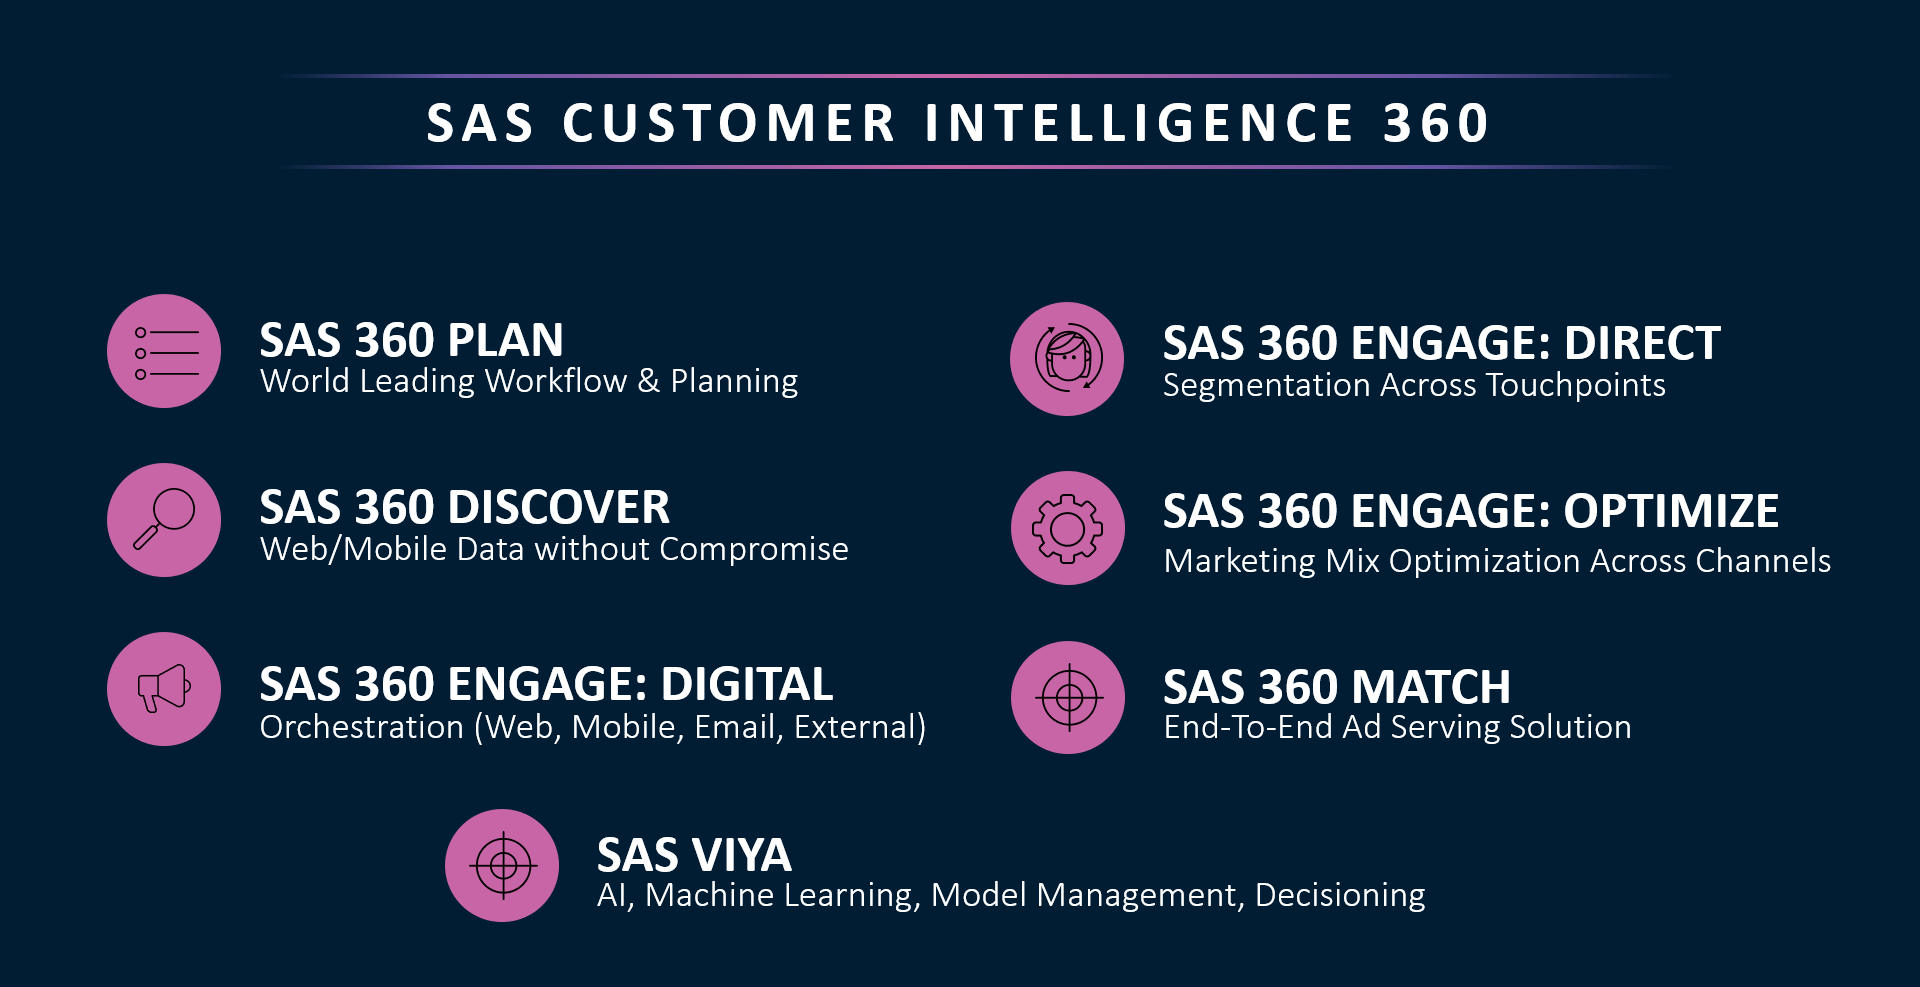
To summarize this milestone release, let's walk through specific highlights:
SAS Customer Intelligence 360 is now a streaming data platform
We've changed how the platform contextualizes data as it's being collected. The new changes support streaming data and real-time contextualization enabling other applications for use in real-time scenarios.
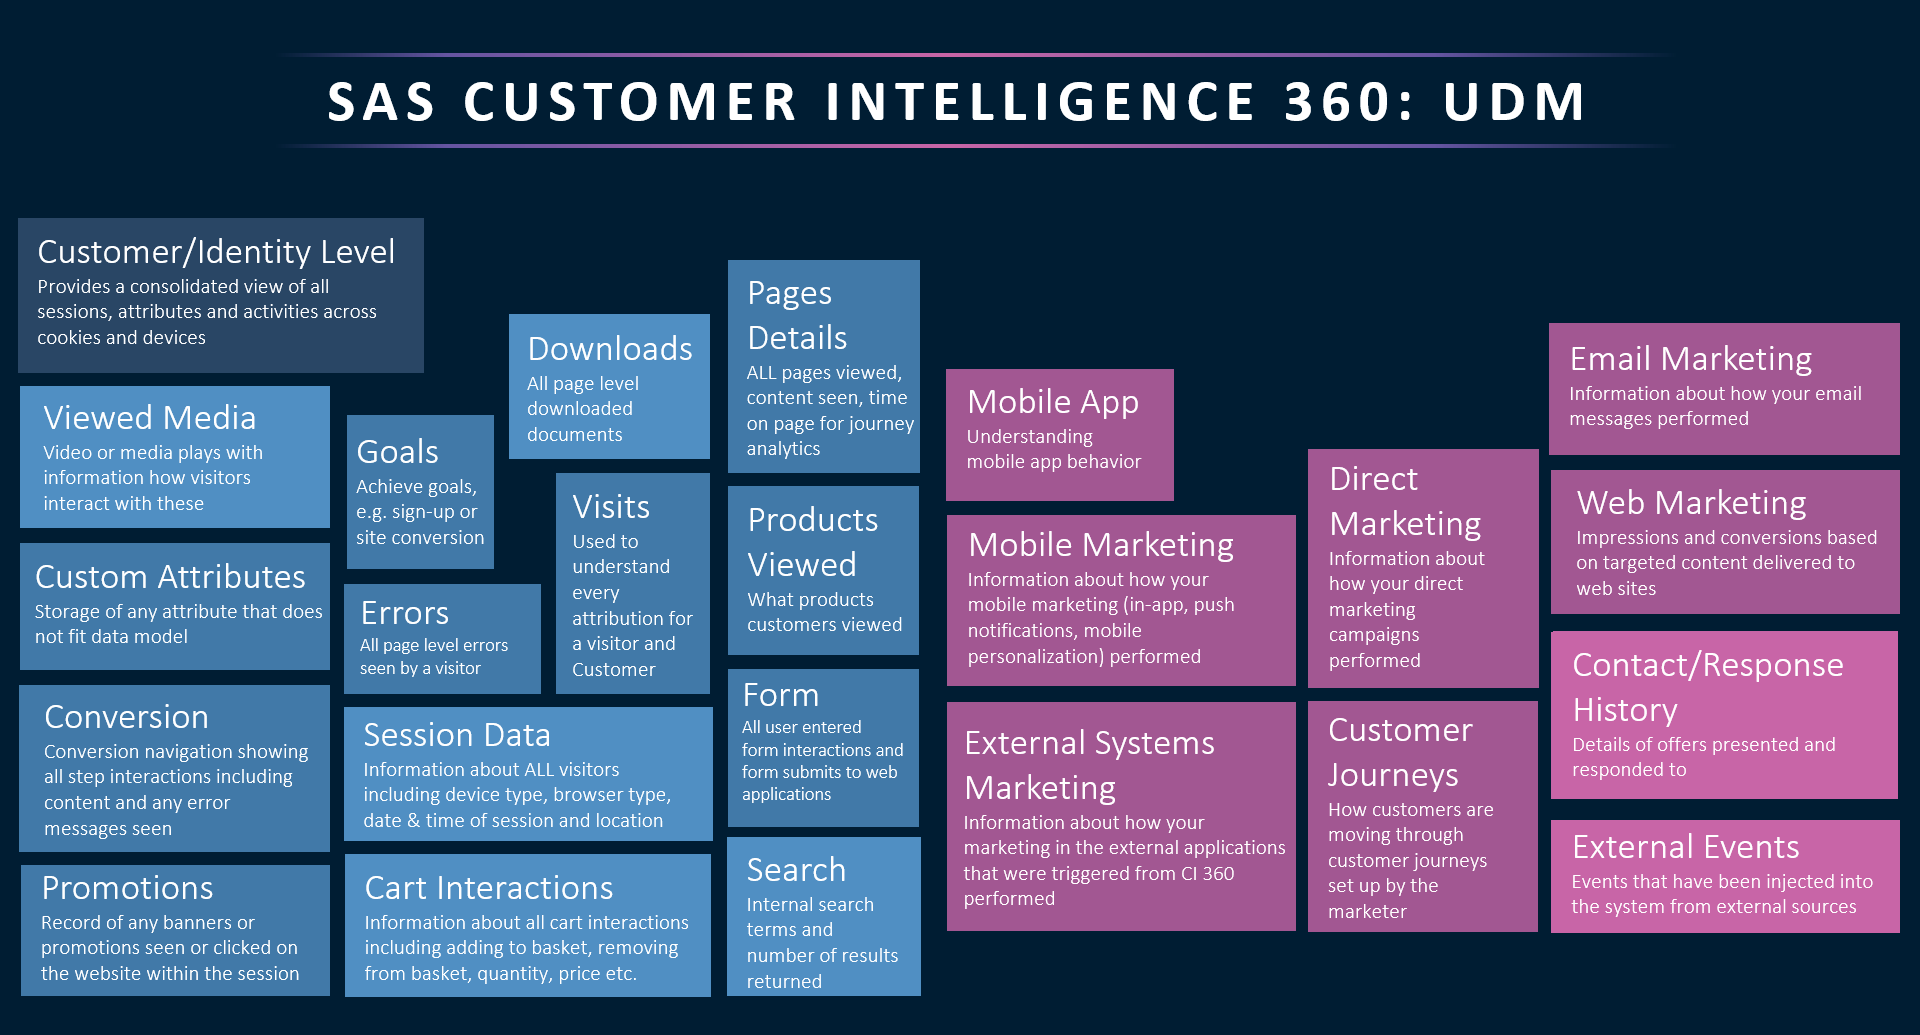
Unified data model (UDM)
The UDM is the complete set of structured tables that are being made available for download (analytics, reporting, online-offline data integration, campaign management, etc). The UDM is the combination of subject area tables previously available as part of the 360 Discover data model with the addition of the 360 Engage and 360 Plan (releasing May 2020) subject area tables.
Analytic base tables (ABT)
No matter what you call them, every analyst is guilty of making the following statement to their leadership team.
"I spend more than 80% of my time preparing data, and less than 20% actually performing analysis."
Speed bumps like this usually emerge when marketing teams require advanced insights like propensity scoring that are not available in a typical digital analytics software package. Have you ever tried to extract HIT (or click-level) data from your preferred marketing cloud vendor? It's not formatted for machine learning or AI applications, and time is lost in the complex efforts to re-engineer that information.
With that said, I've been waiting for years to share this game-changing value proposition. Analytic base tables represent a flat table schema that's used for building analytical models and scoring (predicting) the future behavior of a subject. A single record in this table represents the subject of the prediction (such as a customer or anonymous visitor) and stores all data (variables, features or predictors) describing this subject.
ABTs are now available as part of the structured tables in the SAS Customer Intelligence 360 UDM. Let me provide an example.
The Attribution ABT is the table that SAS Customer Intelligence 360 uses as a source for attribution modeling. Each row in the attribution table represents one customer interaction. Currently, the table shows two types of data: origination data (i.e. traffic sources) and conversion events (based on your defined macro- or micro-goals) that are associated with data views (i.e. events of interest). You can download the table and take one of these actions:
- Run the data against your own analytical models in SAS, open source, etc.
- Append any other data you have, such as direct marketing contact and response records, to the table for a more robust set of information.
- Review the data that SAS Customer Intelligence 360 uses as a source for automated attribution modeling.
Accessing this data is critical for users, and SAS has added these download programs in GitHub so that you can subscribe to notifications for program updates. The SAS software version of the download program can be found at here, while the Python version is here. For the latest details related to the March 2020 release of SAS Customer Intelligence 360, please visit this SAS Communities posting.
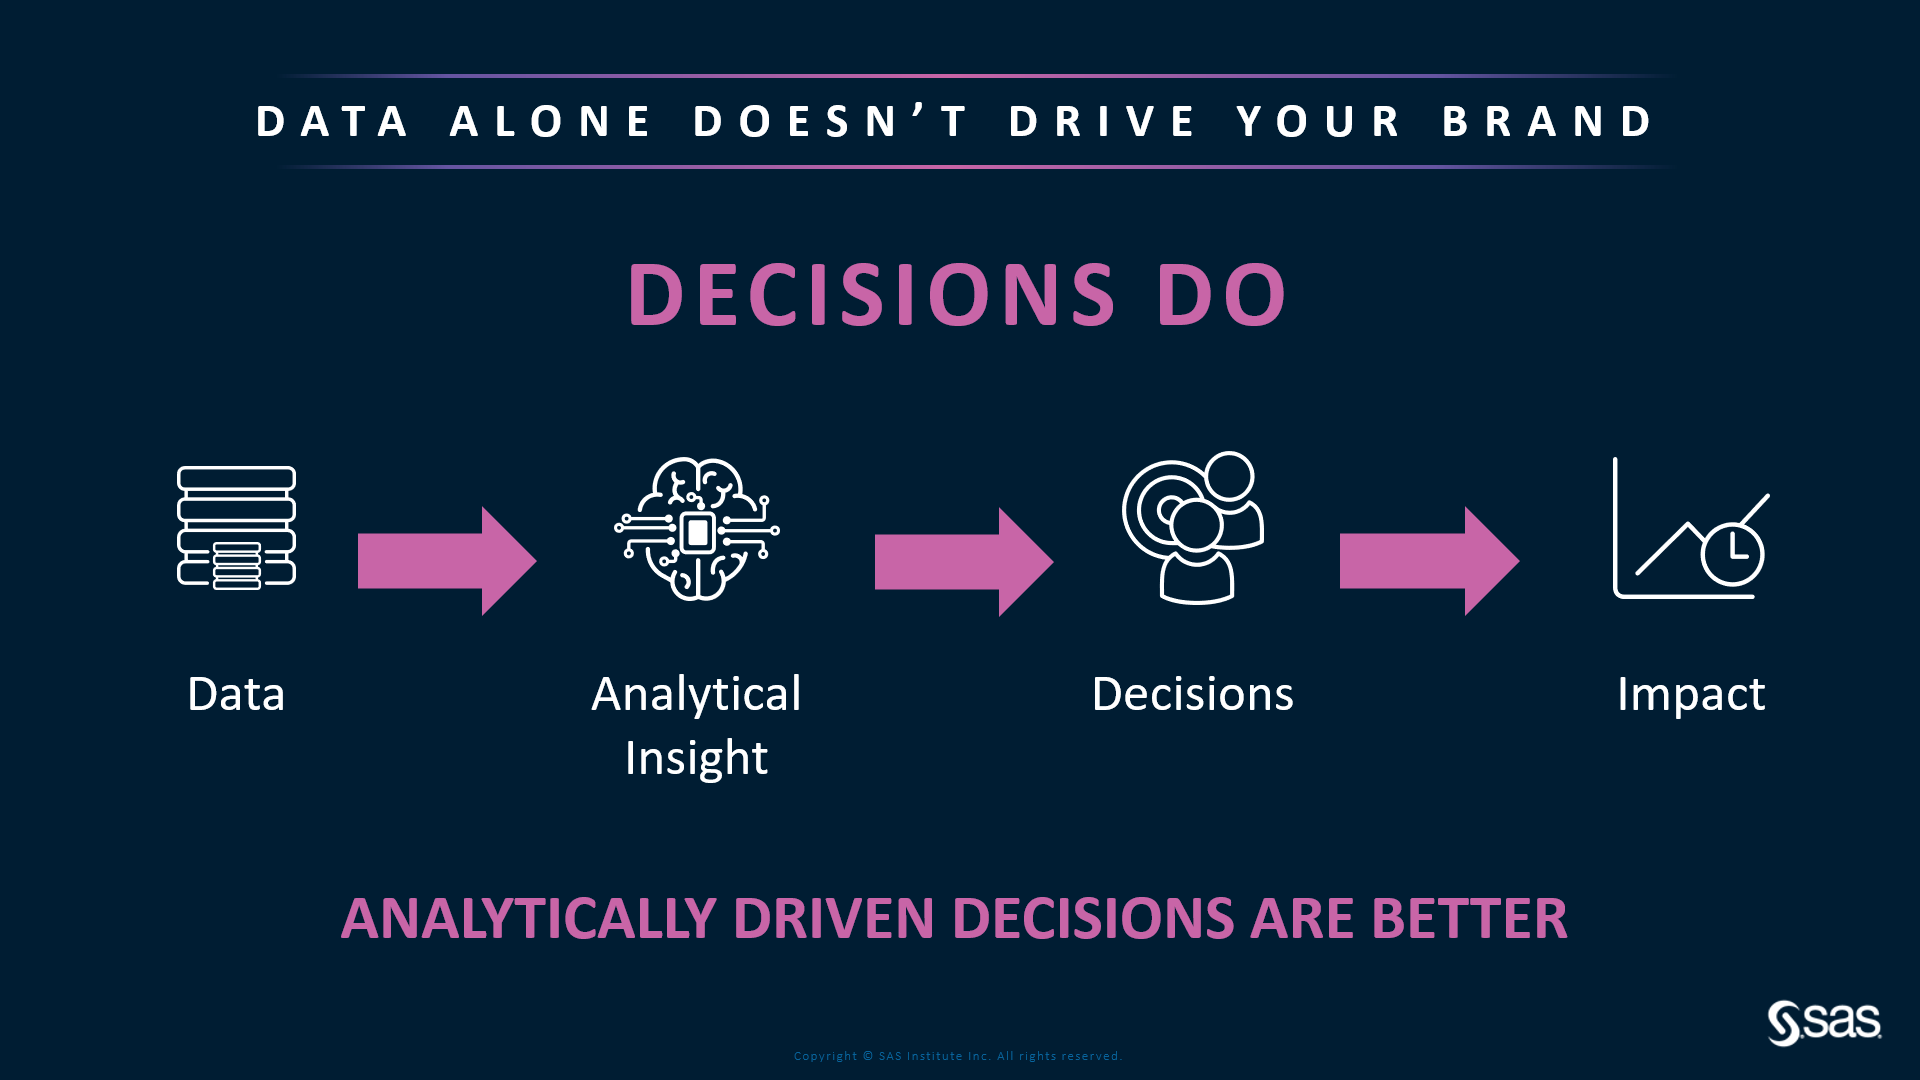
With the advances of a wider and deeper set of first-party data now available from SAS Customer Intelligence 360, the importance of actionable decisions derived from analytically-derived insights is increasing. Let's transition to the topic of recent advances in automated machine learning.
Automated machine learning
Automated machine learning (commonly referred to as AutoML) involves automating the tasks that are required for building a predictive model based on machine learning algorithms. These tasks include data cleansing, feature engineering, variable importance, model selection and hyperparameter tuning, which can be tedious to perform manually. Platforms that provide this capability offer many benefits, such as empowering analysts by giving them a start at a machine learning workflow, as well as allowing advanced data scientists to spend less time on model design and more time on making an AI-enhanced marketing campaign a reality.
Automation is not intended to replace the role of data scientists; ideally, there should be support for intervention in these systems to allow the performance of tasks such as domain-specific feature engineering, which can be a critical component of improving the performance of predictive modeling. These systems should be transparent with regard to the algorithms being used, so that users can be aware of, understand, and trust the insights being generated.
SAS provides different levels of automation that can be included in the machine learning pipeline-building process. Users can do any combination of automated tasks, such as having the system determine variable roles and levels, create the best transformation for numeric features, generate new features, and more. Alternatively, the entire process can be automated, through a graphical user interface as well as using a REST API. As an example, the Machine Learning Pipeline Automation API can be integrated into your own applications to automatically build a pipeline, run it, and return the champion model, which can then be deployed.
Automating the entire pipeline
Let's focus on the benefits of accessible ABTs from SAS Customer Intelligence 360, and tools available to users in SAS Visual Data Mining & Machine Learning (VDMML) to have an entire pipeline built using:
- A prebuilt template.
- A dynamically generated pipeline specifically tailored to your data.
Prebuilt templates
Users can access a broad array of prebuilt pipeline templates for machine learning and feature engineering. These easy-to-use tools give you the means to apply modern modeling techniques to your data so that you can quickly integrate analytical insights earlier into the decision making cycle.
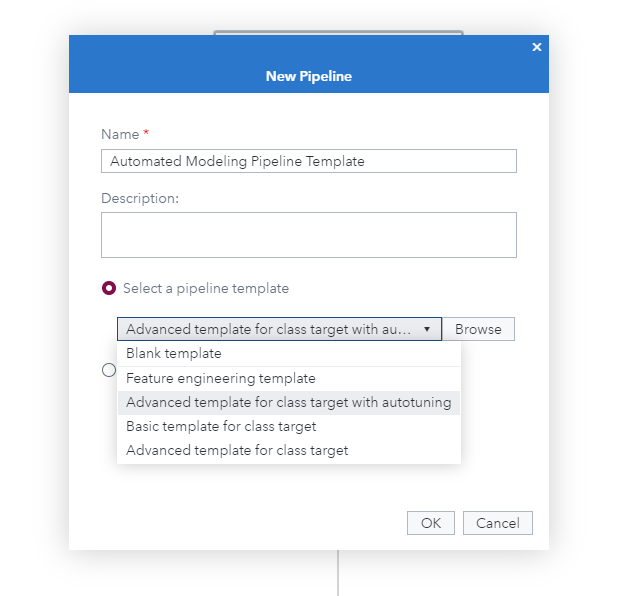
Users can choose from basic, intermediate and advanced (with or without autotuning). There are two versions of each template — one where the target is a class (categorical) variable, and one where the target is an interval (continuous) variable.
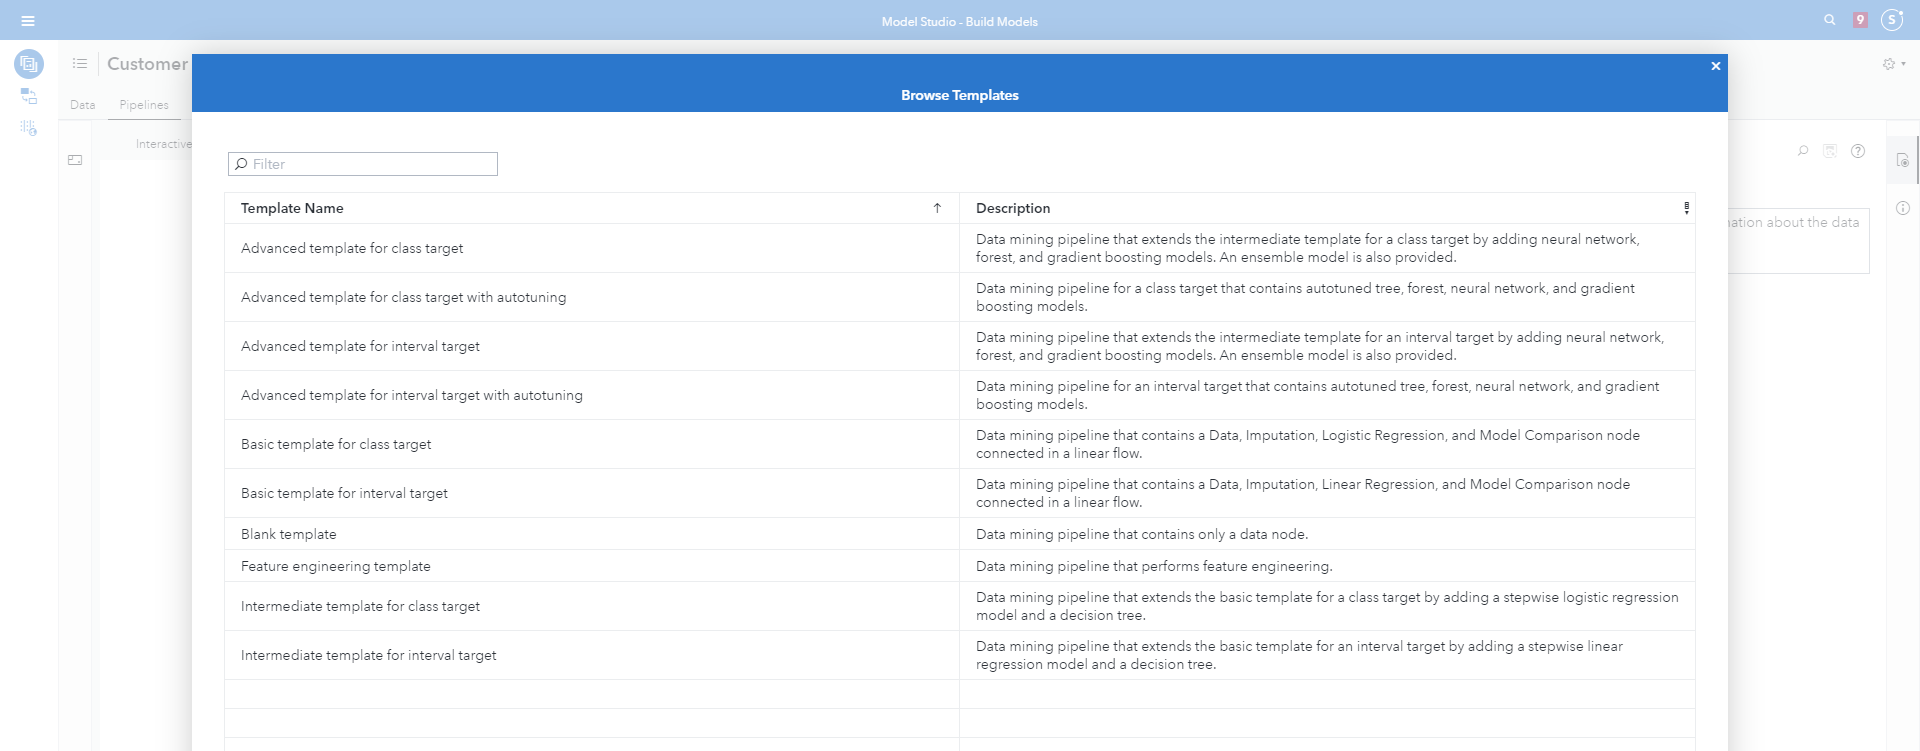
Once the user selects their preferred template, the platform creates this.
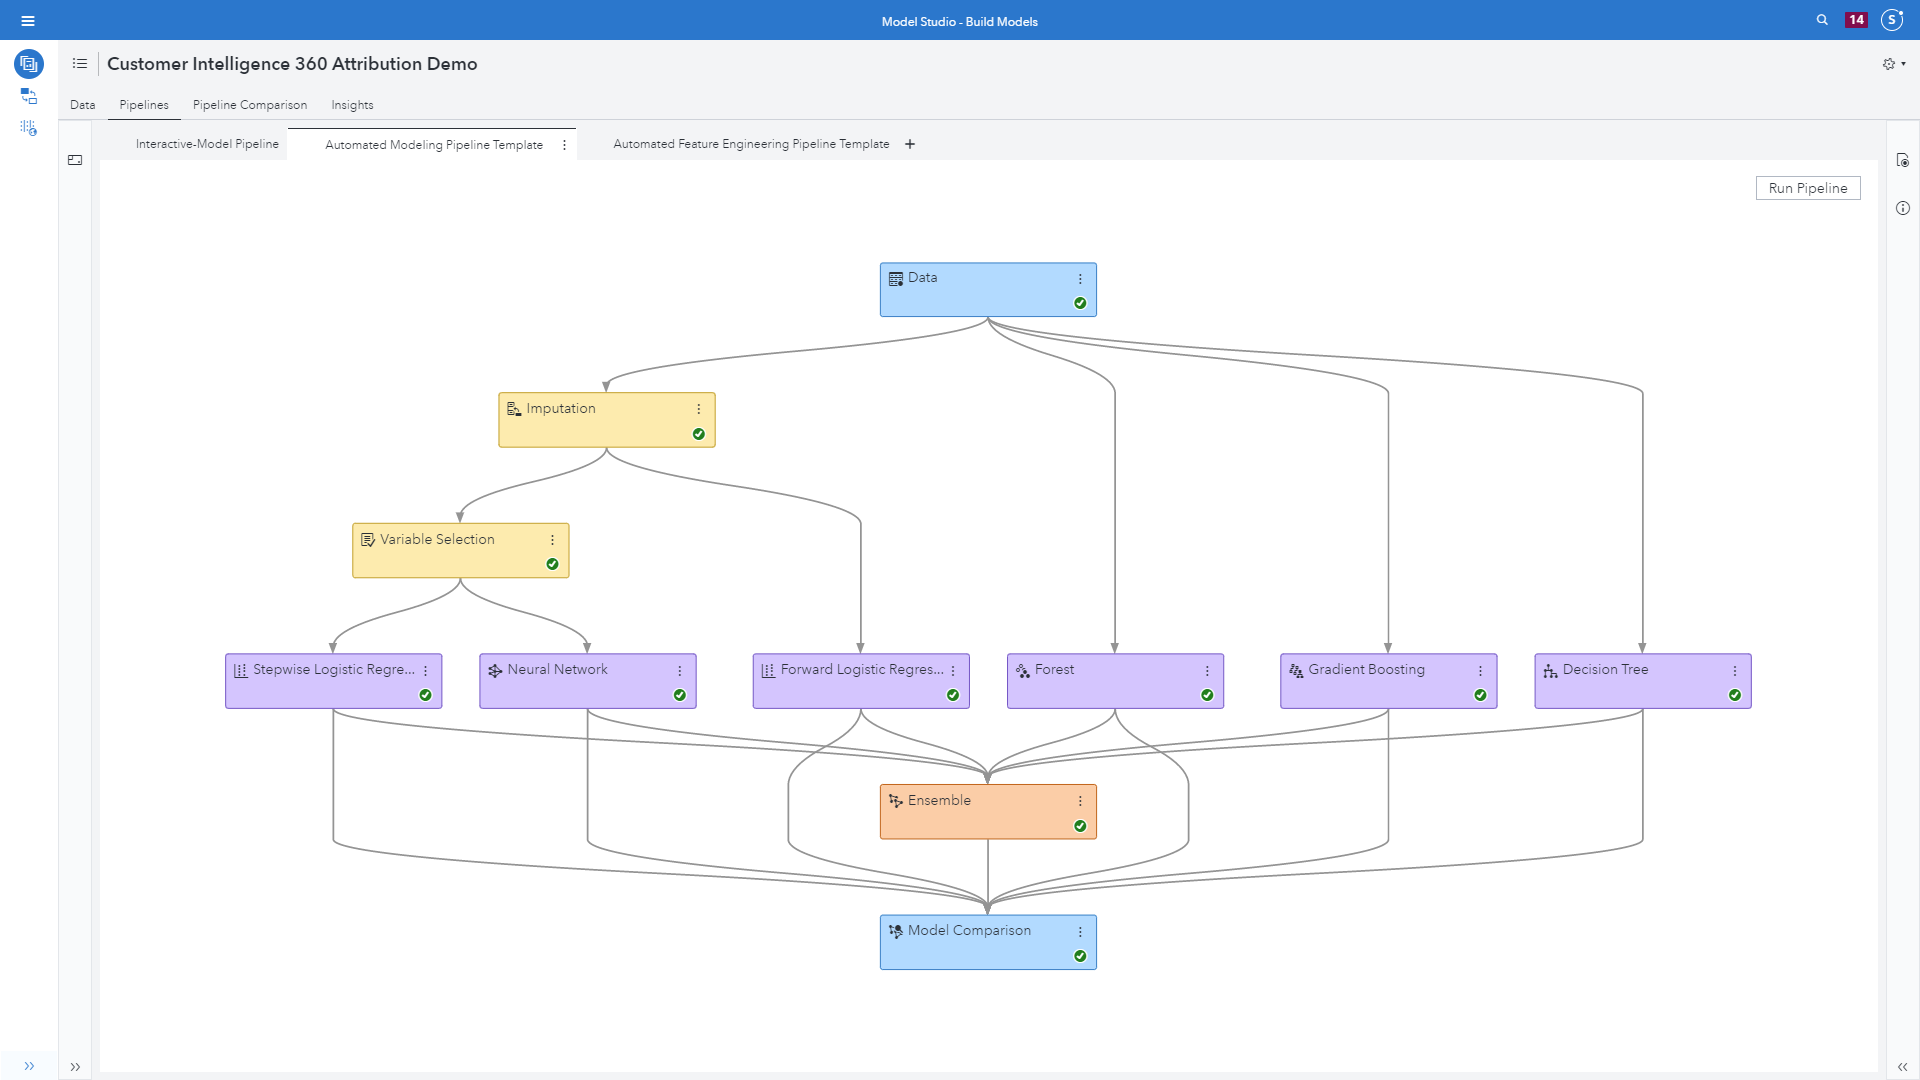
A lovely aspect for users is that nothing is black-box. Access to modeling properties remain available, as well as the ability to generate a variety of modeling interpretability visualizations, such as:
- Variable importance.
- PD plots.
- ICE plots.
- LIME.
- Kernel SHAP.
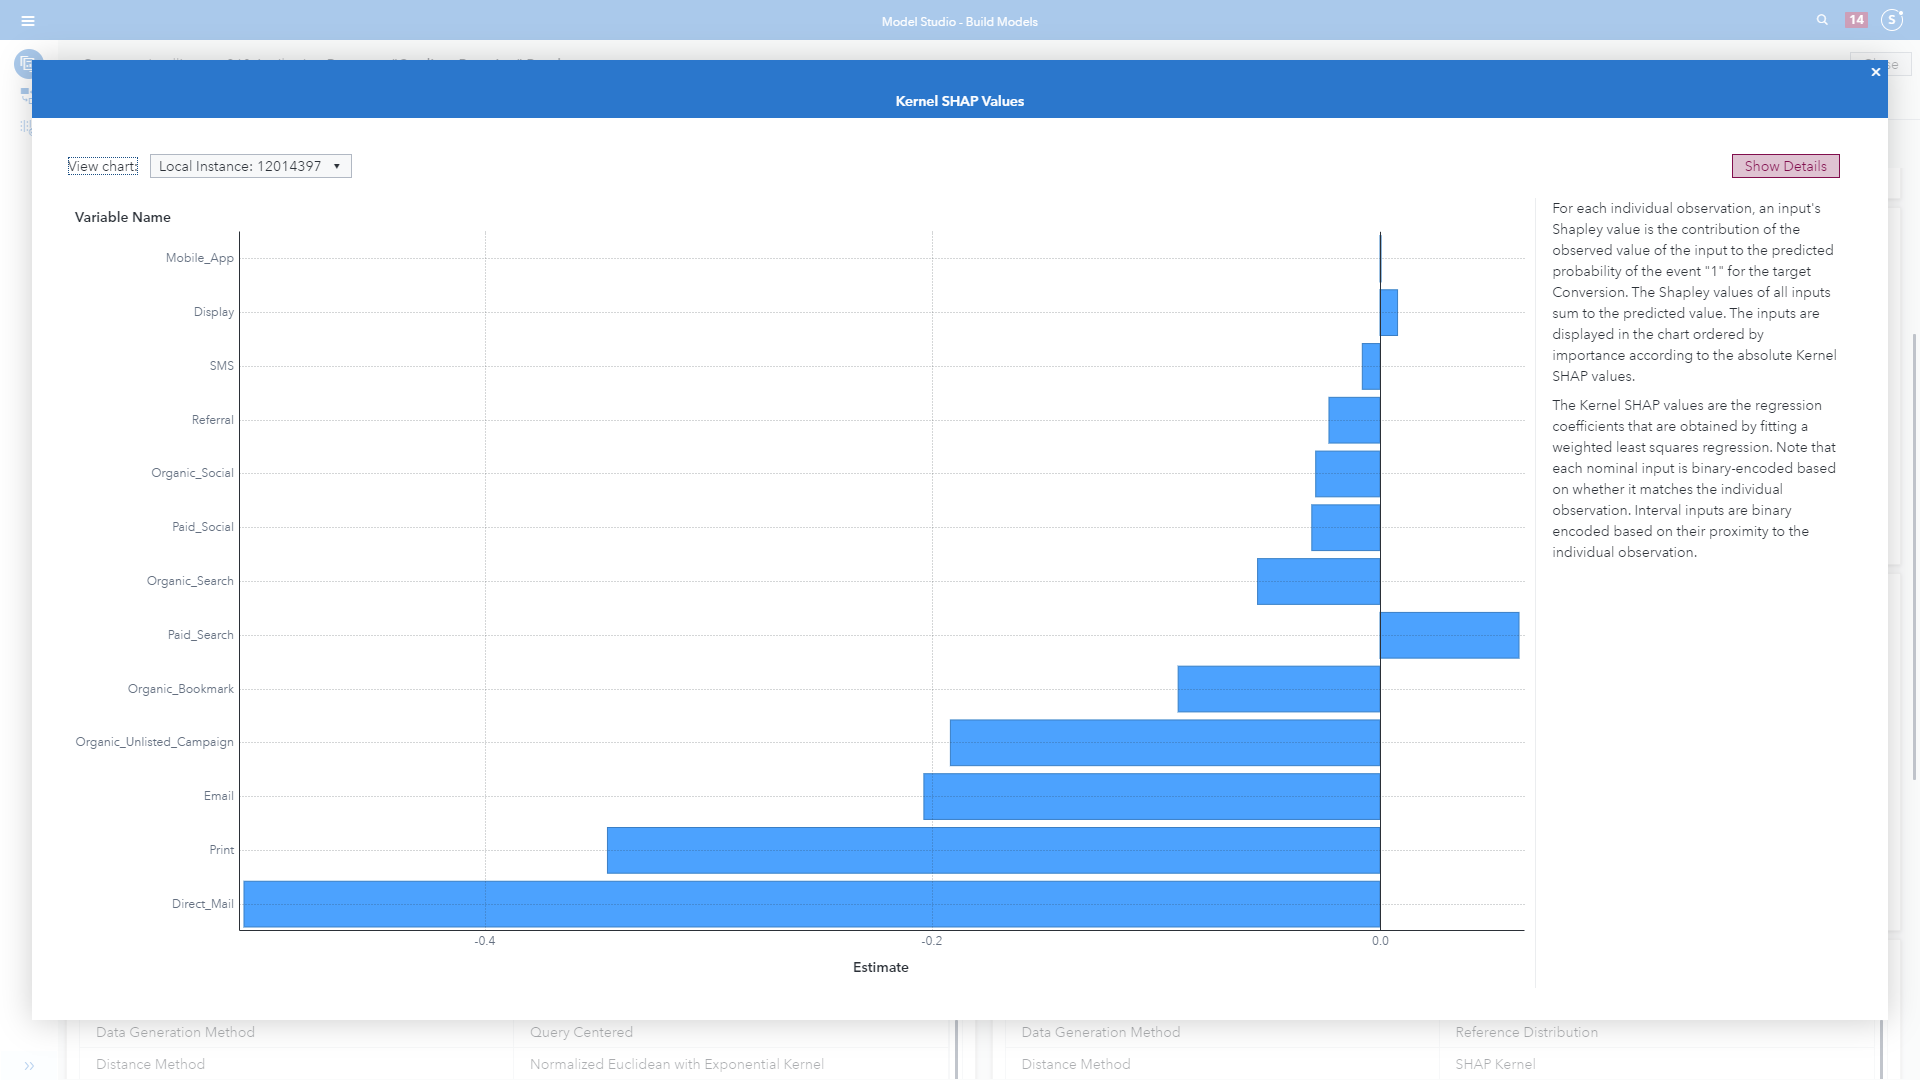
In Image 7, check out the natural language generated explanation to the right of the visualization driven by the data itself. For more examples and information on prebuilt modeling pipeline templates, review this SAS Global Forum 2020 technical white paper.
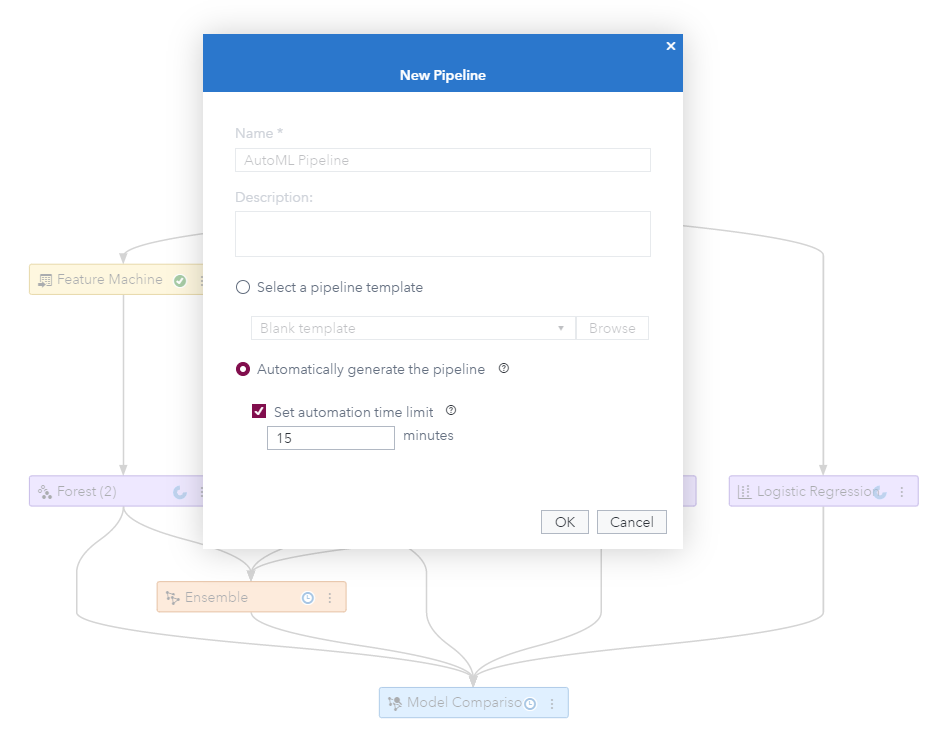
Dynamically generated pipelines
One of the most exciting new features in feeding data captured from SAS Customer Intelligence 360 into SAS VDMML is the option to use automated machine learning to dynamically build a pipeline based on your data. This process performs data preparation, model building, model comparison and model selection to create a pipeline.
In other words, it combines some of the automation concepts mentioned previously with intelligence used behind the scenes to dynamically create the optimal pipeline for your data. It takes the advanced templates a step further by improving on their champion models using techniques such as:
- Applying the Best transformation method to interval inputs.
- Binning and/or encoding variables to create new features.
- Imputing and/or creating missing value indicators.
- Generating a set of new features for each input based on its characteristics.
- Selecting important inputs.
- Creating an ensemble model of two or more of the top branches of the pipeline.
When the pipeline has been generated, the nodes and associated properties provide details of the data preprocessing steps and supervised learning algorithms that are being used; there is no black box in this process. You can run the pipeline as is, or edit it to include your domain knowledge by adding, deleting or modifying nodes. Other subsequent tasks that could be adjusted include:
- Performing hyperparameter autotuning in the supervised learning nodes.
- Comparing the champion from this pipeline with a pipeline that you have manually built or with a pipeline from a template.
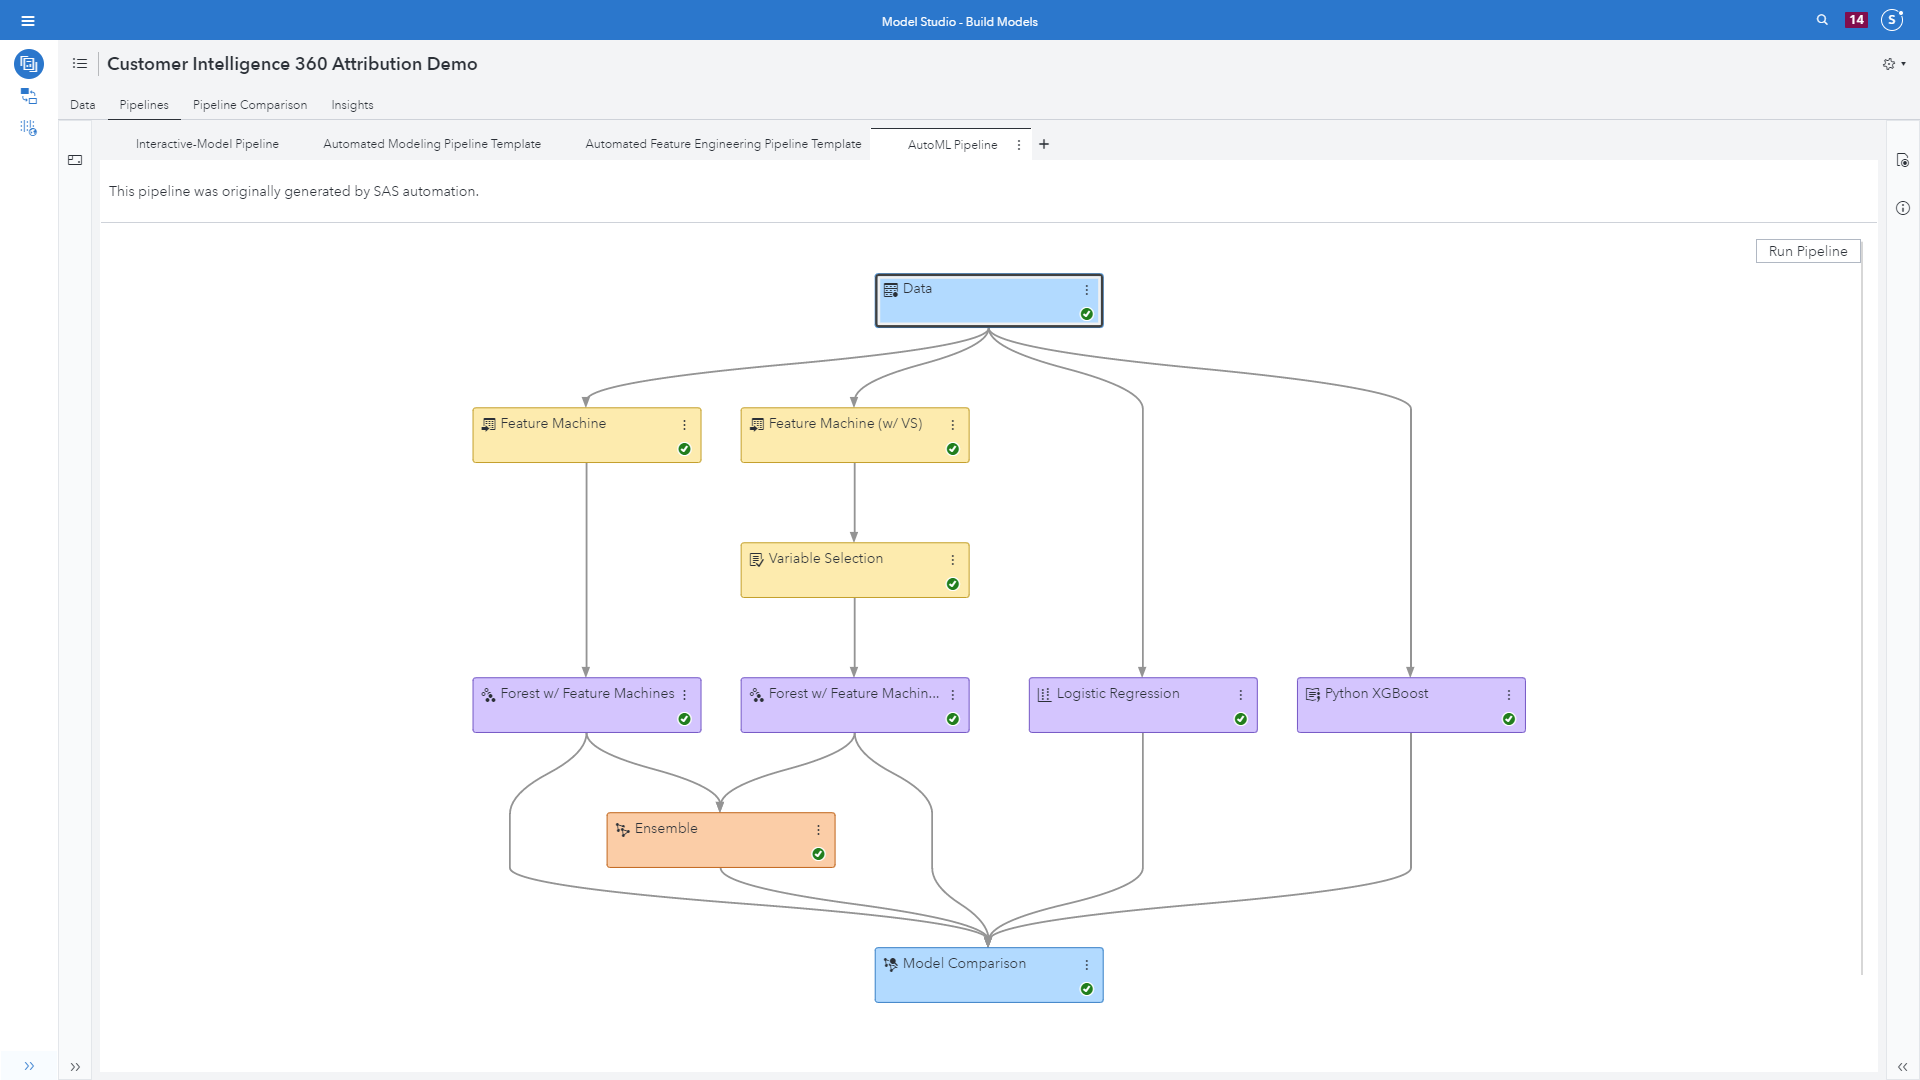
Using the Attribution ABT data table from SAS Customer Intelligence 360 (see image 9 below) presents an example of the automatically generated pipeline. The models included are:
- A forest model with two new features generated per input by using the feature machine node, as well as hyperparameter autotuning.
- The feature machine node generates new features by performing variable transformations to improve data quality and improve model accuracy. New features are generated to fix data quality issues related to high cardinality, kurtosis, skewness, low entropy, missing values and outliers.
- A forest model also using the feature machine node, as well as variable selection leveraging both unsupervised and supervised methods to reduce the number of modeling inputs.
- An open source Python XGBoost model.
- A logistic regression model included for interpretability.
- An ensemble model that averages the posterior probabilities of the forest models.
Comparing pipelines
The value proposition of data-driven attribution is the ability to leverage machine learning and increase accuracy of classifying conversions and non-conversion customer journeys to understand what drives favorable consumer behavior. What did we learn from this exercise?
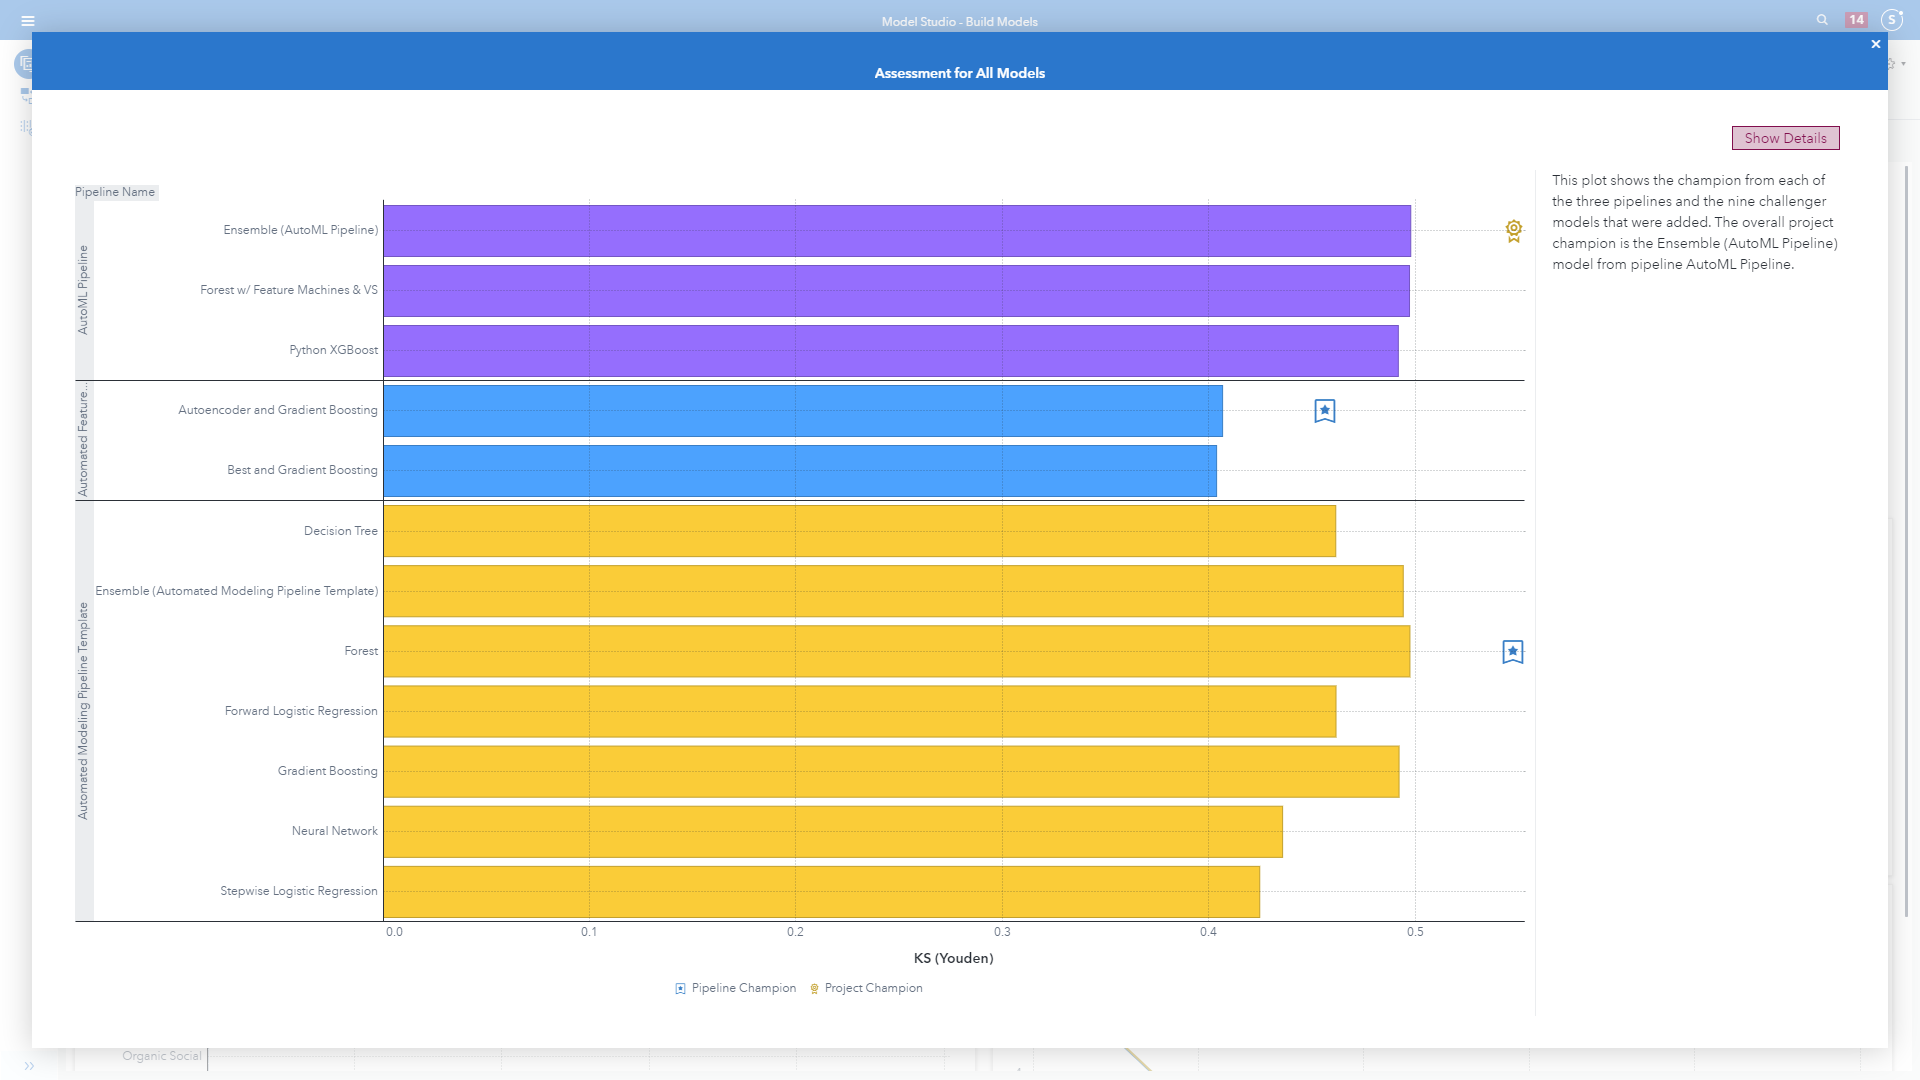
The plot in image 10 above shows the champion from each of the pipelines and the competing challenger models. The overall project champion is the Ensemble from the AutoML Pipeline.

The plot in image 11 shows the most important traffic sources (or originations), as determined by their relative importance. The relative importance is calculated using a one-level decision tree for each input to estimate the predicted value as a global surrogate model. The most important input for this model is Paid Search. The input Organic Search has a relative importance of 0.19, for example, which means it is 0.19 times as important as Paid Search.
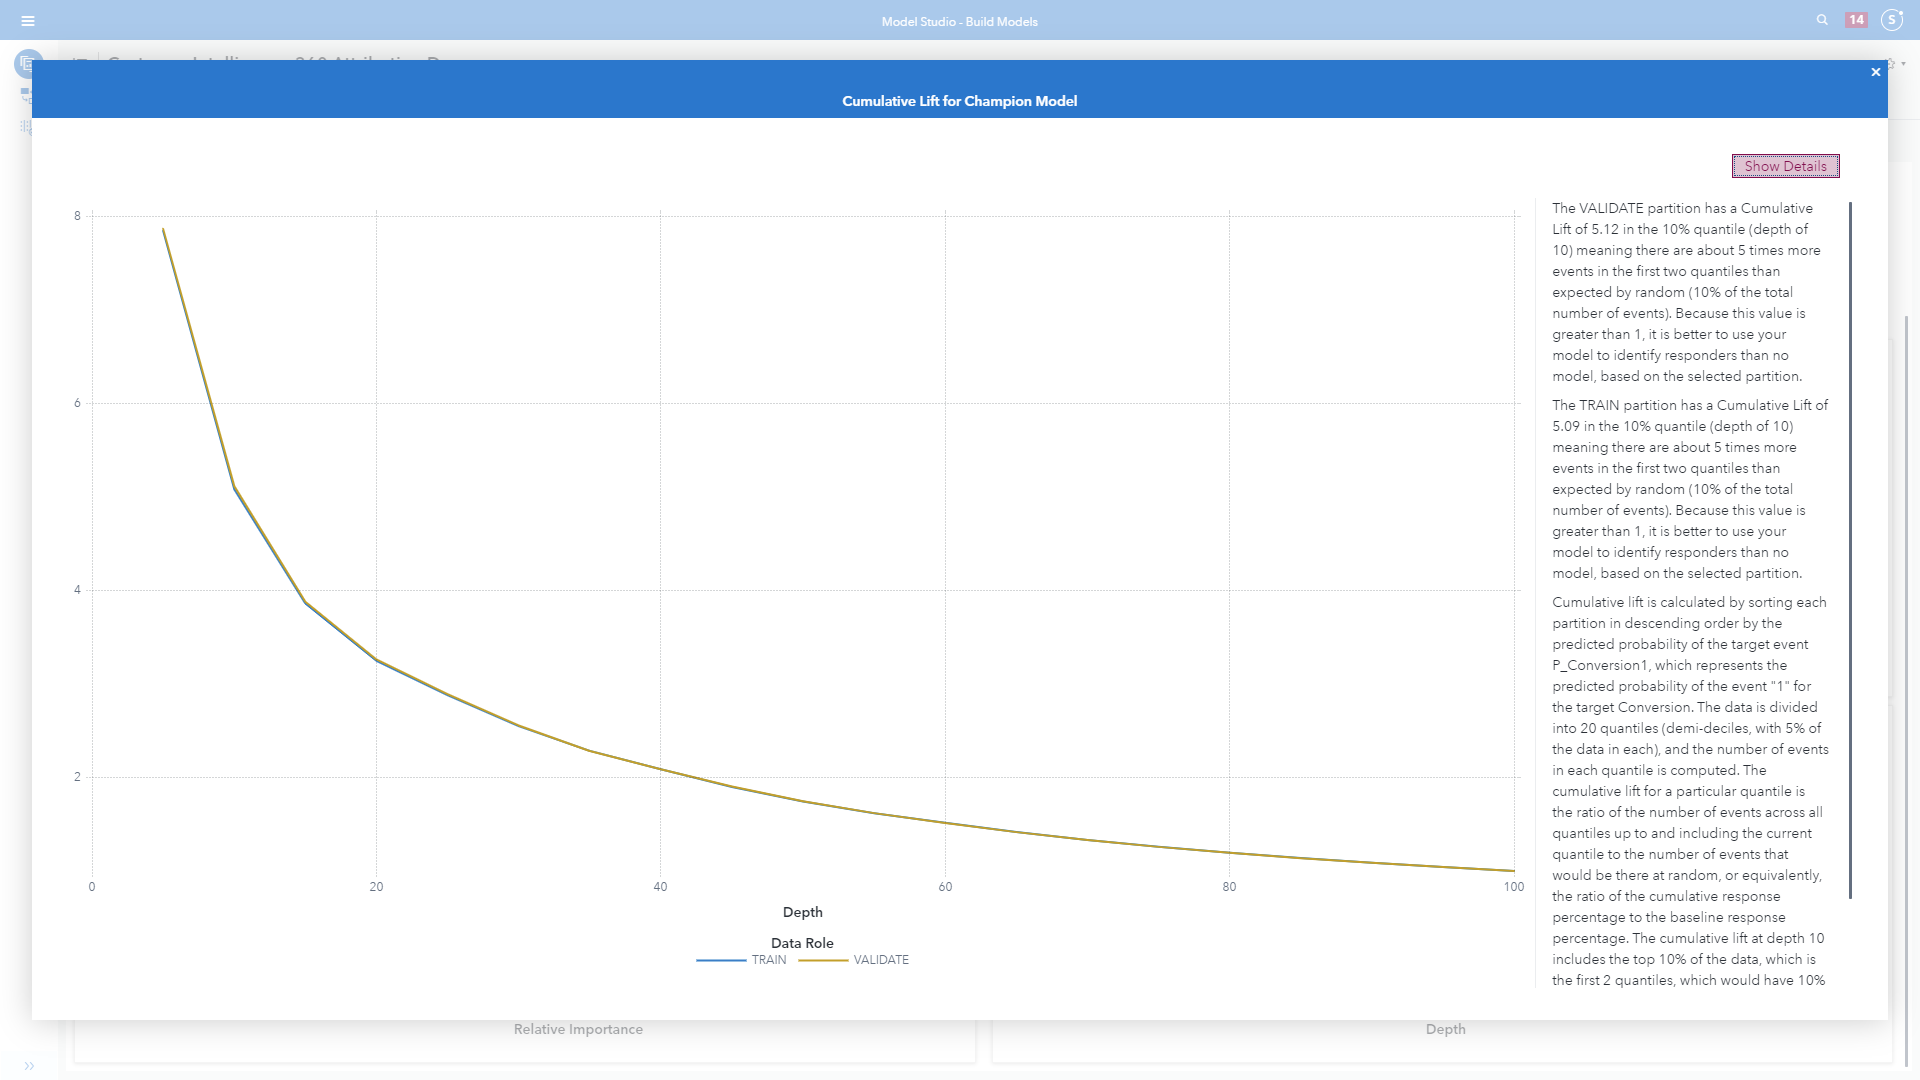
The plot in image 12 has a cumulative lift of 5.12 in the 10% quantile (depth of 10) meaning there are about five times more events in the first two quantiles than expected by random (10% of the total number of events). Because this value is greater than 1, it is better to use this model to identify converters than no model, based on the selected partition. In other words, the 10% quantile represents a discovered segment that converts five times more often than the marketable population as a whole.
Completing analytics' last mile
The automation of key tasks involved in the building of machine learning models is an integral part of data-driven attribution. The automation of these complex and time-consuming tasks aid in democratizing machine learning, reduces the time to reach actionable decisions and increases the importance of ModelOps.
The majority of attribution use cases that leverage these insights are for:
- Influencing paid media teams in optimizing budgetary allocation and spending decisions.
- Supporting campaign management teams in improving their segmentation, targeting and personalization tactics.
Influencing paid media decision-making
One of the traditional steps of communicating with other teams begins with visualization (or reporting), and the elegance of sharing the data story.
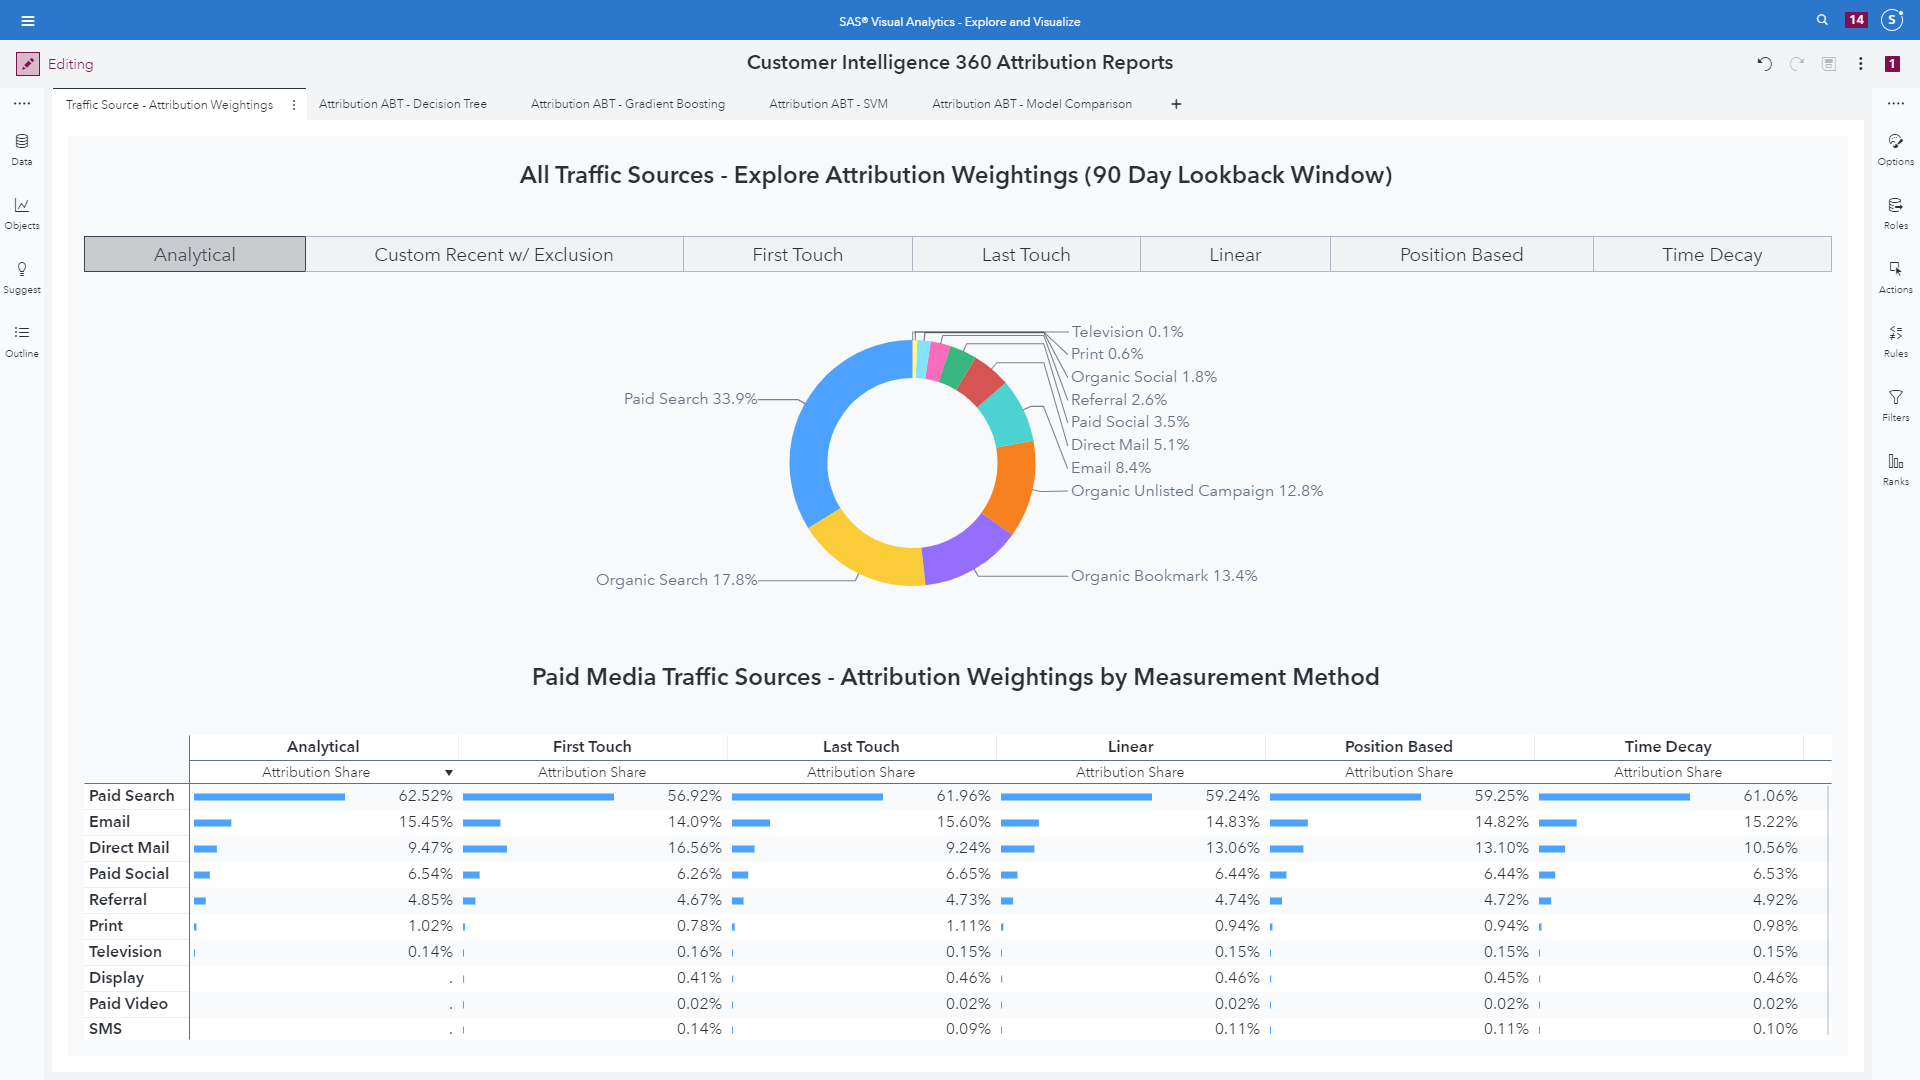
Although reporting and modeling represent crucial ingredients to marketing analytics, the connection or "ah-ha" moment emerges when the attribution weights of importance for channels connect to and optimize budget allocations for paid media spending decisions.
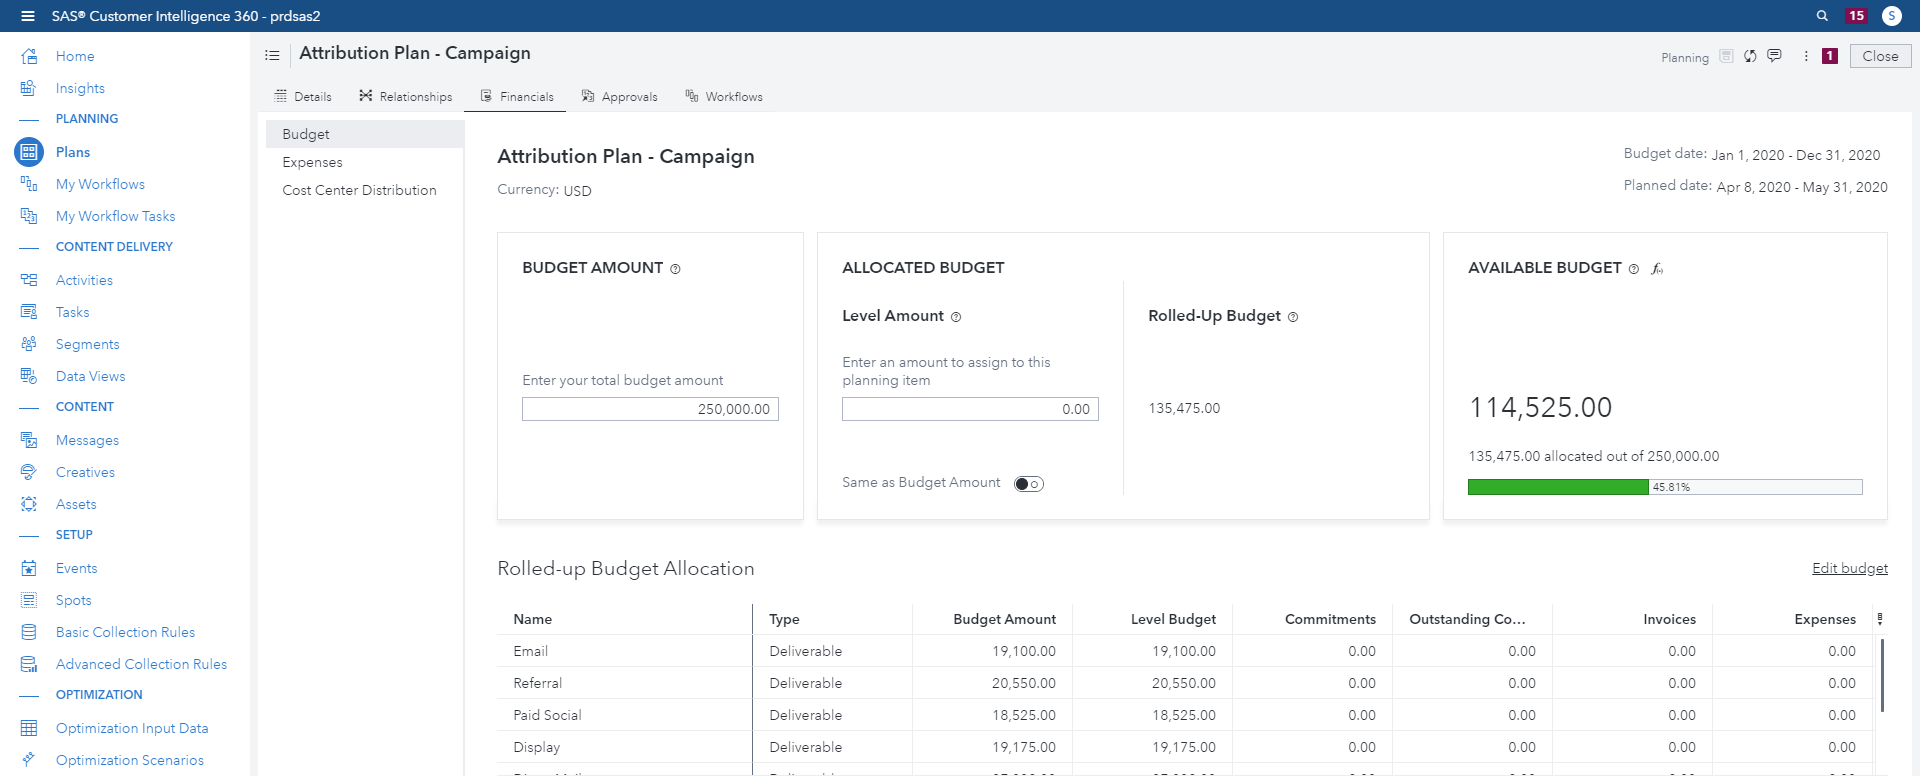
Marketers can use SAS Customer Intelligence 360 to integrate and manage end-to-end planning processes.
- Plan strategically and collaboratively to ensure that your marketing plan aligns with your brand’s objectives.
- Manage finances with an integrated budget that tracks expenses and automatically update your plans and calendars.
- Use an integrated calendar to schedule and track timing of plans and tasks for marketing efforts.
- Use workflows to manage assignments and get real-time visibility into project timelines.
By integrating planning, execution, and monitoring of your marketing objectives with the analytical scoring of attribution models, brands can monitor whether their objectives are on track. As consumer behavioral changes are detected in future iterations of attribution modeling, the ability to quickly change your strategy as necessary can follow.
Supporting campaign management tactics
Attribution analysis has always had the potential to provide more insight than just channel performance in accordance with a defined objective. Getting to your website or app is just half the battle, as we also desire to understand what interactions between the consumer and your brand provide predictive power in meeting desirable conversion events. The depth of data available in the SAS Customer Intelligence 360 UDM enables this.
For example, in Image 12 above, why does 10% of the marketable population convert at an incrementally higher rate? That audience should be segmented for deeper analysis using more data, and subsequently made available for future targeting and testing.
Segmentation should also be freed from channel silos, and once defined, be available for targeting and testing across any channel. Whether that is a single channel campaign, or a customer journey across multiple channels. Recommended reading from SAS Global Forum 2020 on this subject here.
Together the intent is to better understand and manage customer activity, regardless of channel, in alignment with a brand’s goals and objectives. At the end of the day, both the analytical-minded and the creative-minded need to be in lockstep with one another.
To learn more about how the SAS platform can be applied to other marketing and customer-centric use cases, please check out additional posts here.