
Modernize the risk modeling life cycle by moving to cloud

Go from gridlocked model development to accelerated innovation by moving to the cloud.
Go from gridlocked model development to accelerated innovation by moving to the cloud.

Look at the following matrices. Do you notice anything that these matrices have in common? If you noticed that the rows of each matrix are arithmetic progressions, good for you. For each row, there is a constant difference (also called the "increment") between adjacent elements. For these examples: In the
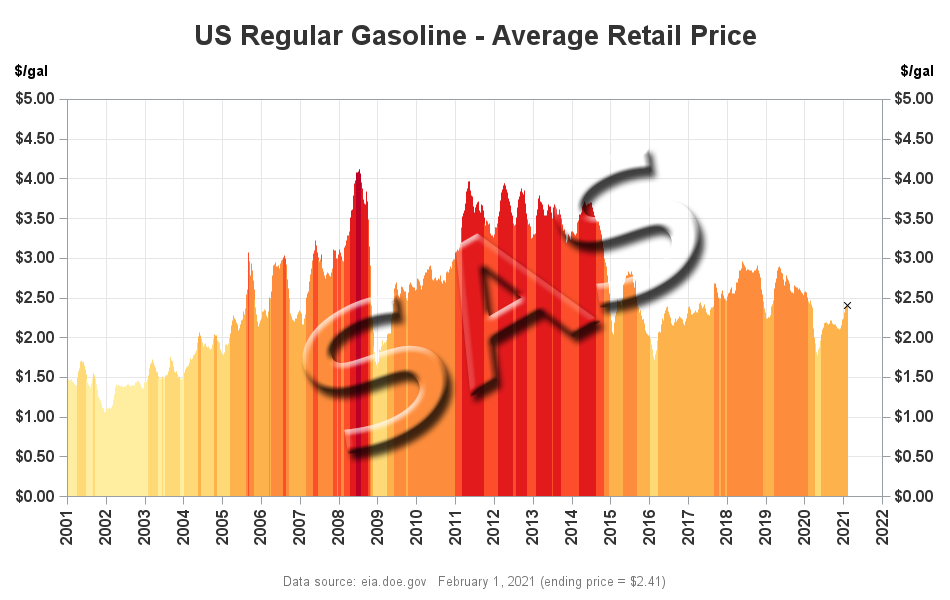
This is another in my series of blogs where I take a deep dive into converting a customized R graph into a SAS ODS Graphics graph. This time the example is a needle plot (that's essentially like a bar plot, with lots of tiny bars, plotted along a continuous xaxis).

