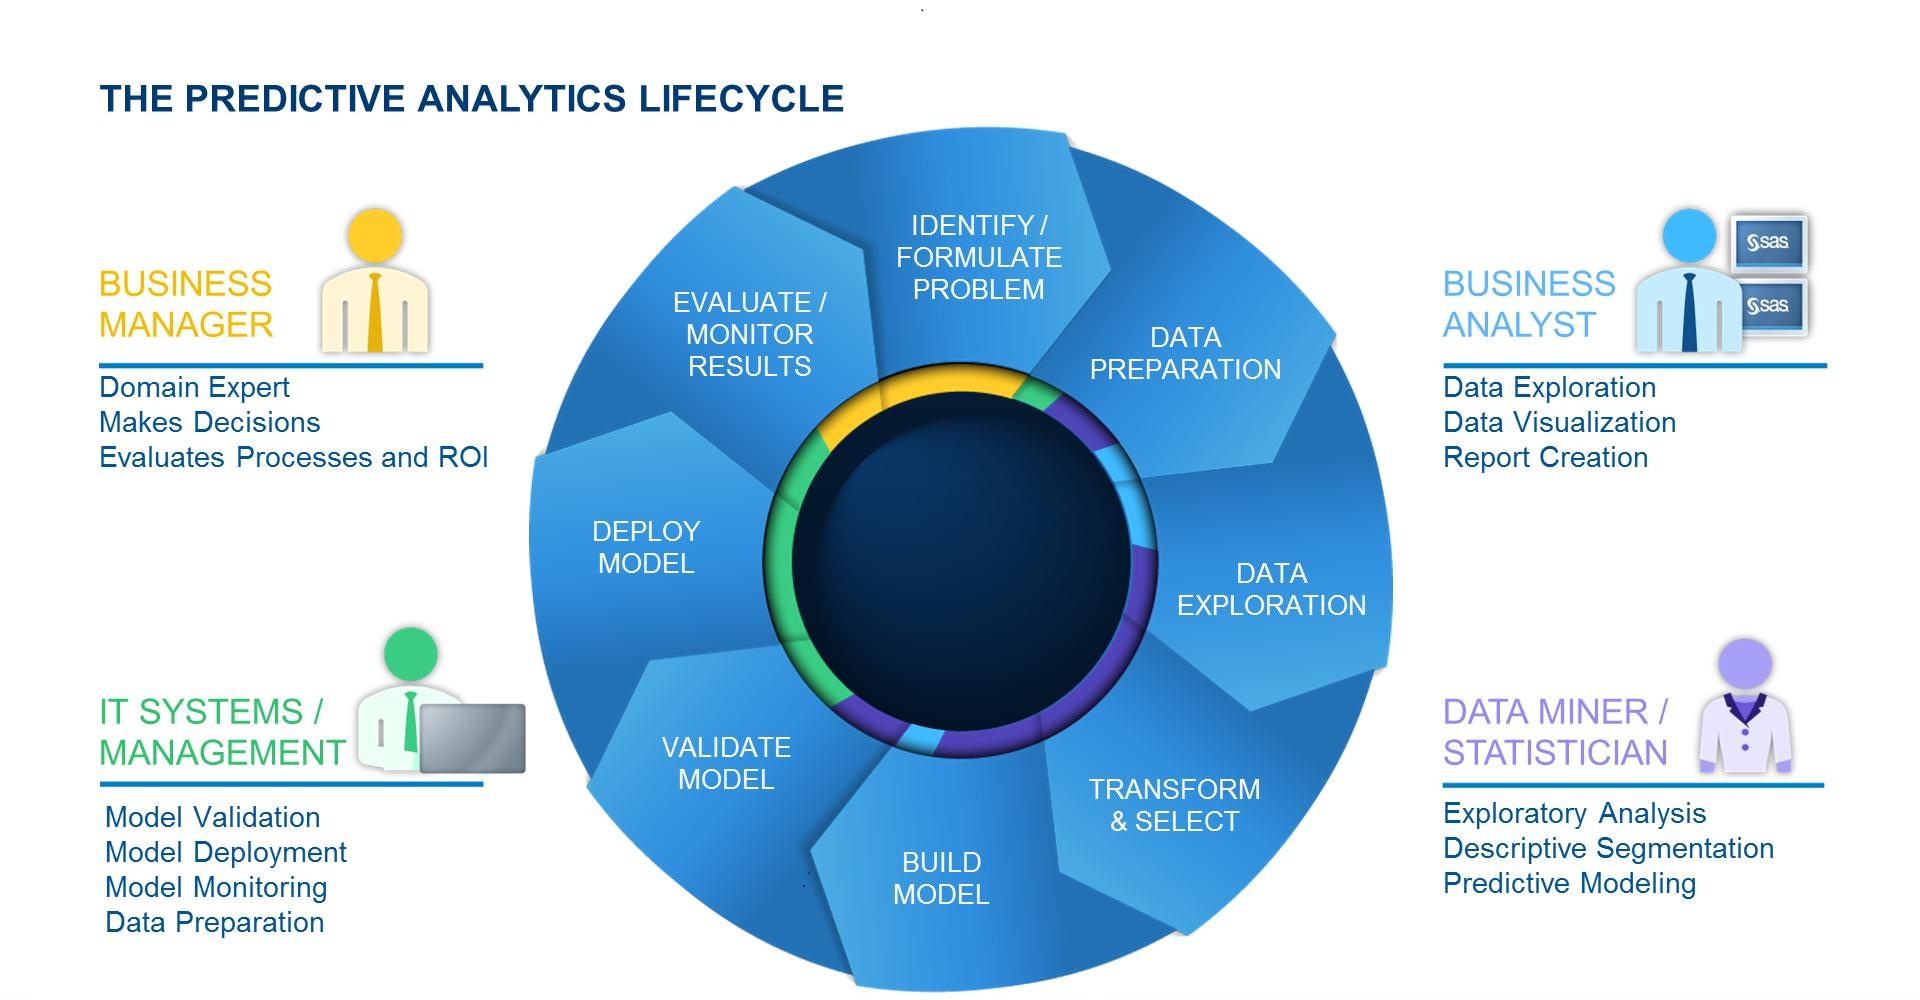
Naomi Robbins has posted a contest, part 1 of which is to submit alternative representations for the following graph: Clearly, usage of two pie charts to represent the share of the B2B and B2C referrals will invite many responses. To create the graph, I took the data shown in the Pie Charts themselves, so we are using percent
Uncategorized
Naomi's Graph Makeover Contest
Hold the flip phone! Outdated data solutions in disaster recovery, planning
Several years ago my mom, bless her heart, bought a cell phone. Now, my mom is not what one would call “tech-savvy”. She has had the same car forever, same furniture for 25 years (well, she did get it reupholstered), even the same pots and pans that came as wedding
Five Recommendations to help in recruiting analytical talent
As rain settles in over the green fields of England, I’ve been reading the Times Higher Education (THE) periodical. It’s always a lively read, as it invariably takes the part of untenured junior lecturers in any dispute. It is also very well researched and informed. This week’s THE edition has