Where to start with overloading

Dylan Jones (@dataqualitypro) explains how data overloading occurs -- and how to find a better solution.
Dylan Jones (@dataqualitypro) explains how data overloading occurs -- and how to find a better solution.
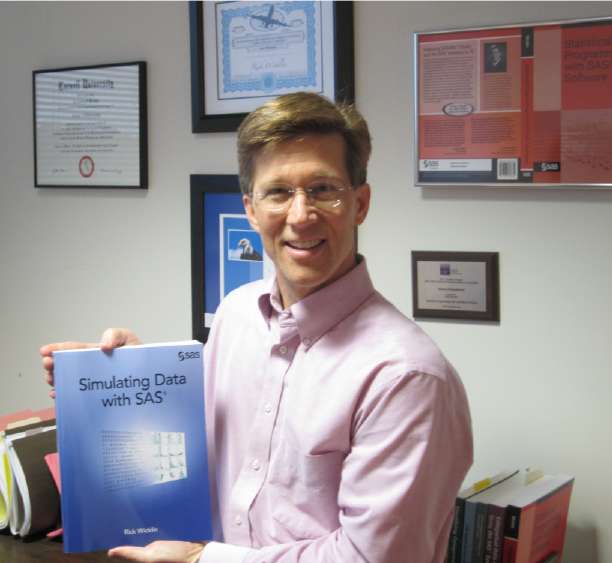
In my constant effort to keep pace with Chris Hemedinger, I am pleased to announce the availability of my new book, Simulating Data with SAS. Chris started a tradition for SAS Press authors to post a photo of themselves with their new book. Thanks to everyone who helped with the

SAS Global Forum is like a BIG buffet of SAS knowledge, all served up in just a few days. There are so many good presentations and activities, but you cannot fit them all on your plate. You have to choose. To make the choices easier, the SAS Global Forum committee

