When teaching statistics, it is often useful to produce a normal density plot with shading under the curve. For example, consider a one-sided hypothesis test. An alpha value of .05 would correspond to a Z-score cutoff of 1.645. This means that 95% of a standard normal curve falls below a
Uncategorized
Producing normal density plots with shading
Teacher effectiveness culture shifts in Lubbock ISD schools – Part 2: The Principals
This is part 2 of a blog series on how Lubbock Independent School District (Lubbock ISD) uses SAS® EVAAS to improve teaching and learning by promoting self-reflection and aiding instructional and administrative decision-making. This is done in a district that, in the past decade, has experienced dramatic increases in the
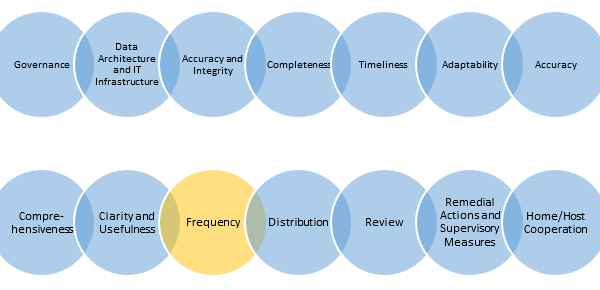
Series: BCBS 239 - Principle 10
Principle 10: Frequency – The board and senior management (or other recipients as appropriate) should set the frequency of risk management report production and distribution. BCBS 239 “Effective Risk Data Aggregation & Risk Reporting”, released in January of 2013, specifically requires that the bank’s board and senior management should be