Tips and Tricks
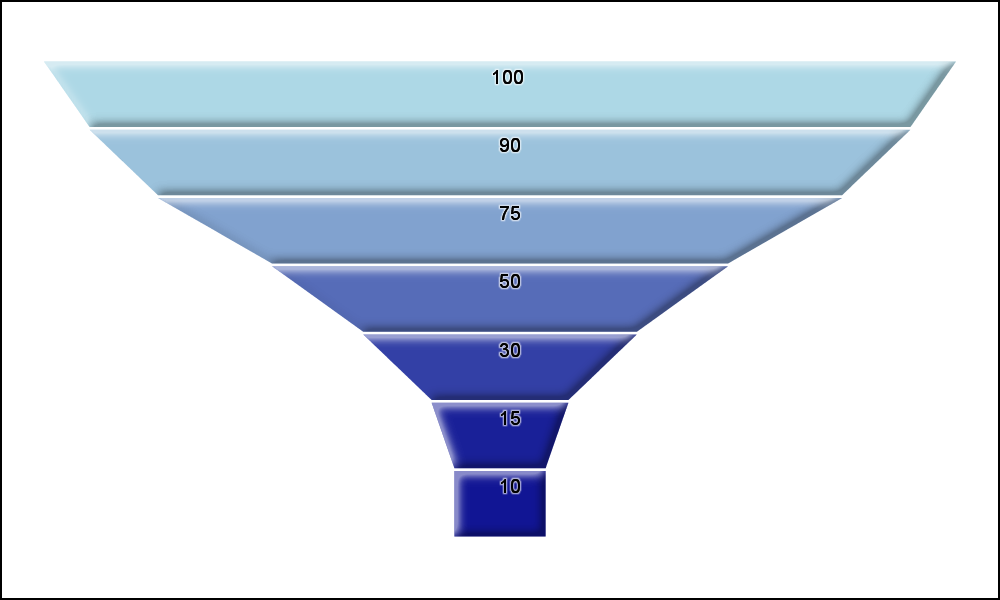
Funnel Graphs

Funnel graphs are useful to track the number of visitors passing through various pages of a website or the number of patients in a study. The graph shows visually the retention of users or subjects in a study across levels of a marketing cycle or the study. One common representation