Feature du jour

Feature du jour

Data Visualization
Sanjay Matange 0
Bubble Plots

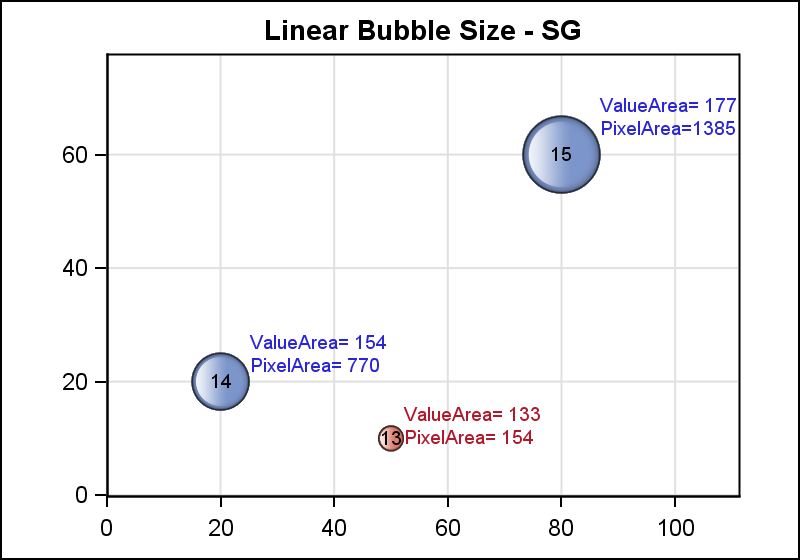
Bubble Plots provide additional ways to visualize your data.  The plot supports display of multiple response characteristics of the data in one graph.  Bubble plots were introduced with SAS 9.3 in GTL and SG Procedures. A bubble is drawn at each (x, y) point in the graph, and each bubble is

Data Visualization
Sanjay Matange 0
Micro Maps

MicroMaps are a powerful way to display data where the display includes small, lightweight maps to provide geographical information regarding the data.  This geographical information gives clues to the relationship between the data that could lead to more insight. The SAS SG Procedures and GTL do not currently have built-in

1 33 34 35 36 37 79

Back to Top