Feature du jour
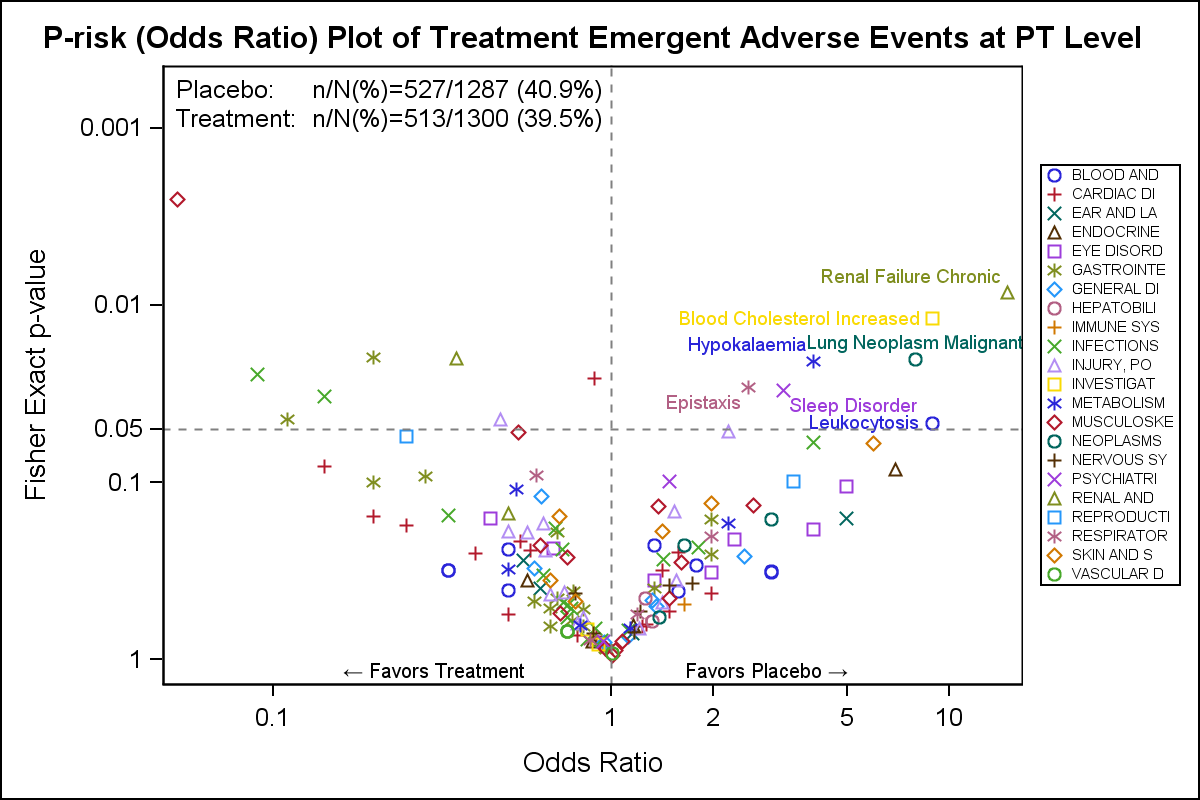
CTSPedia Clinical Graphs - Volcano Plot

A Volcano Plot is a type of scatter-plot that is used to quickly identify changes in large data sets composed of replicate data. In the clinical domain, a Volcano Plot is used to view Risk difference (RD) of AE occurrence (%) between drug and control by preferred term. One example of