Feature du jour
Text plot can do that

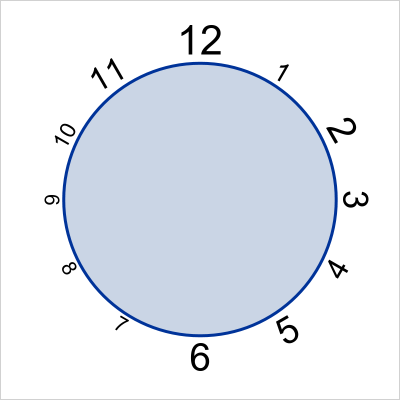
The TEXT plot was introduced with SAS 9.4M2 to facilitate placement of text strings in a graph. This replaces the MARKERCHAR feature of the SCATTER plot statement, which is still available, but it is better to use TEXT plot in most cases. The syntax is: text x=column y=column text=column </