Advanced ODS Graphics: Inserting a graph into a graph

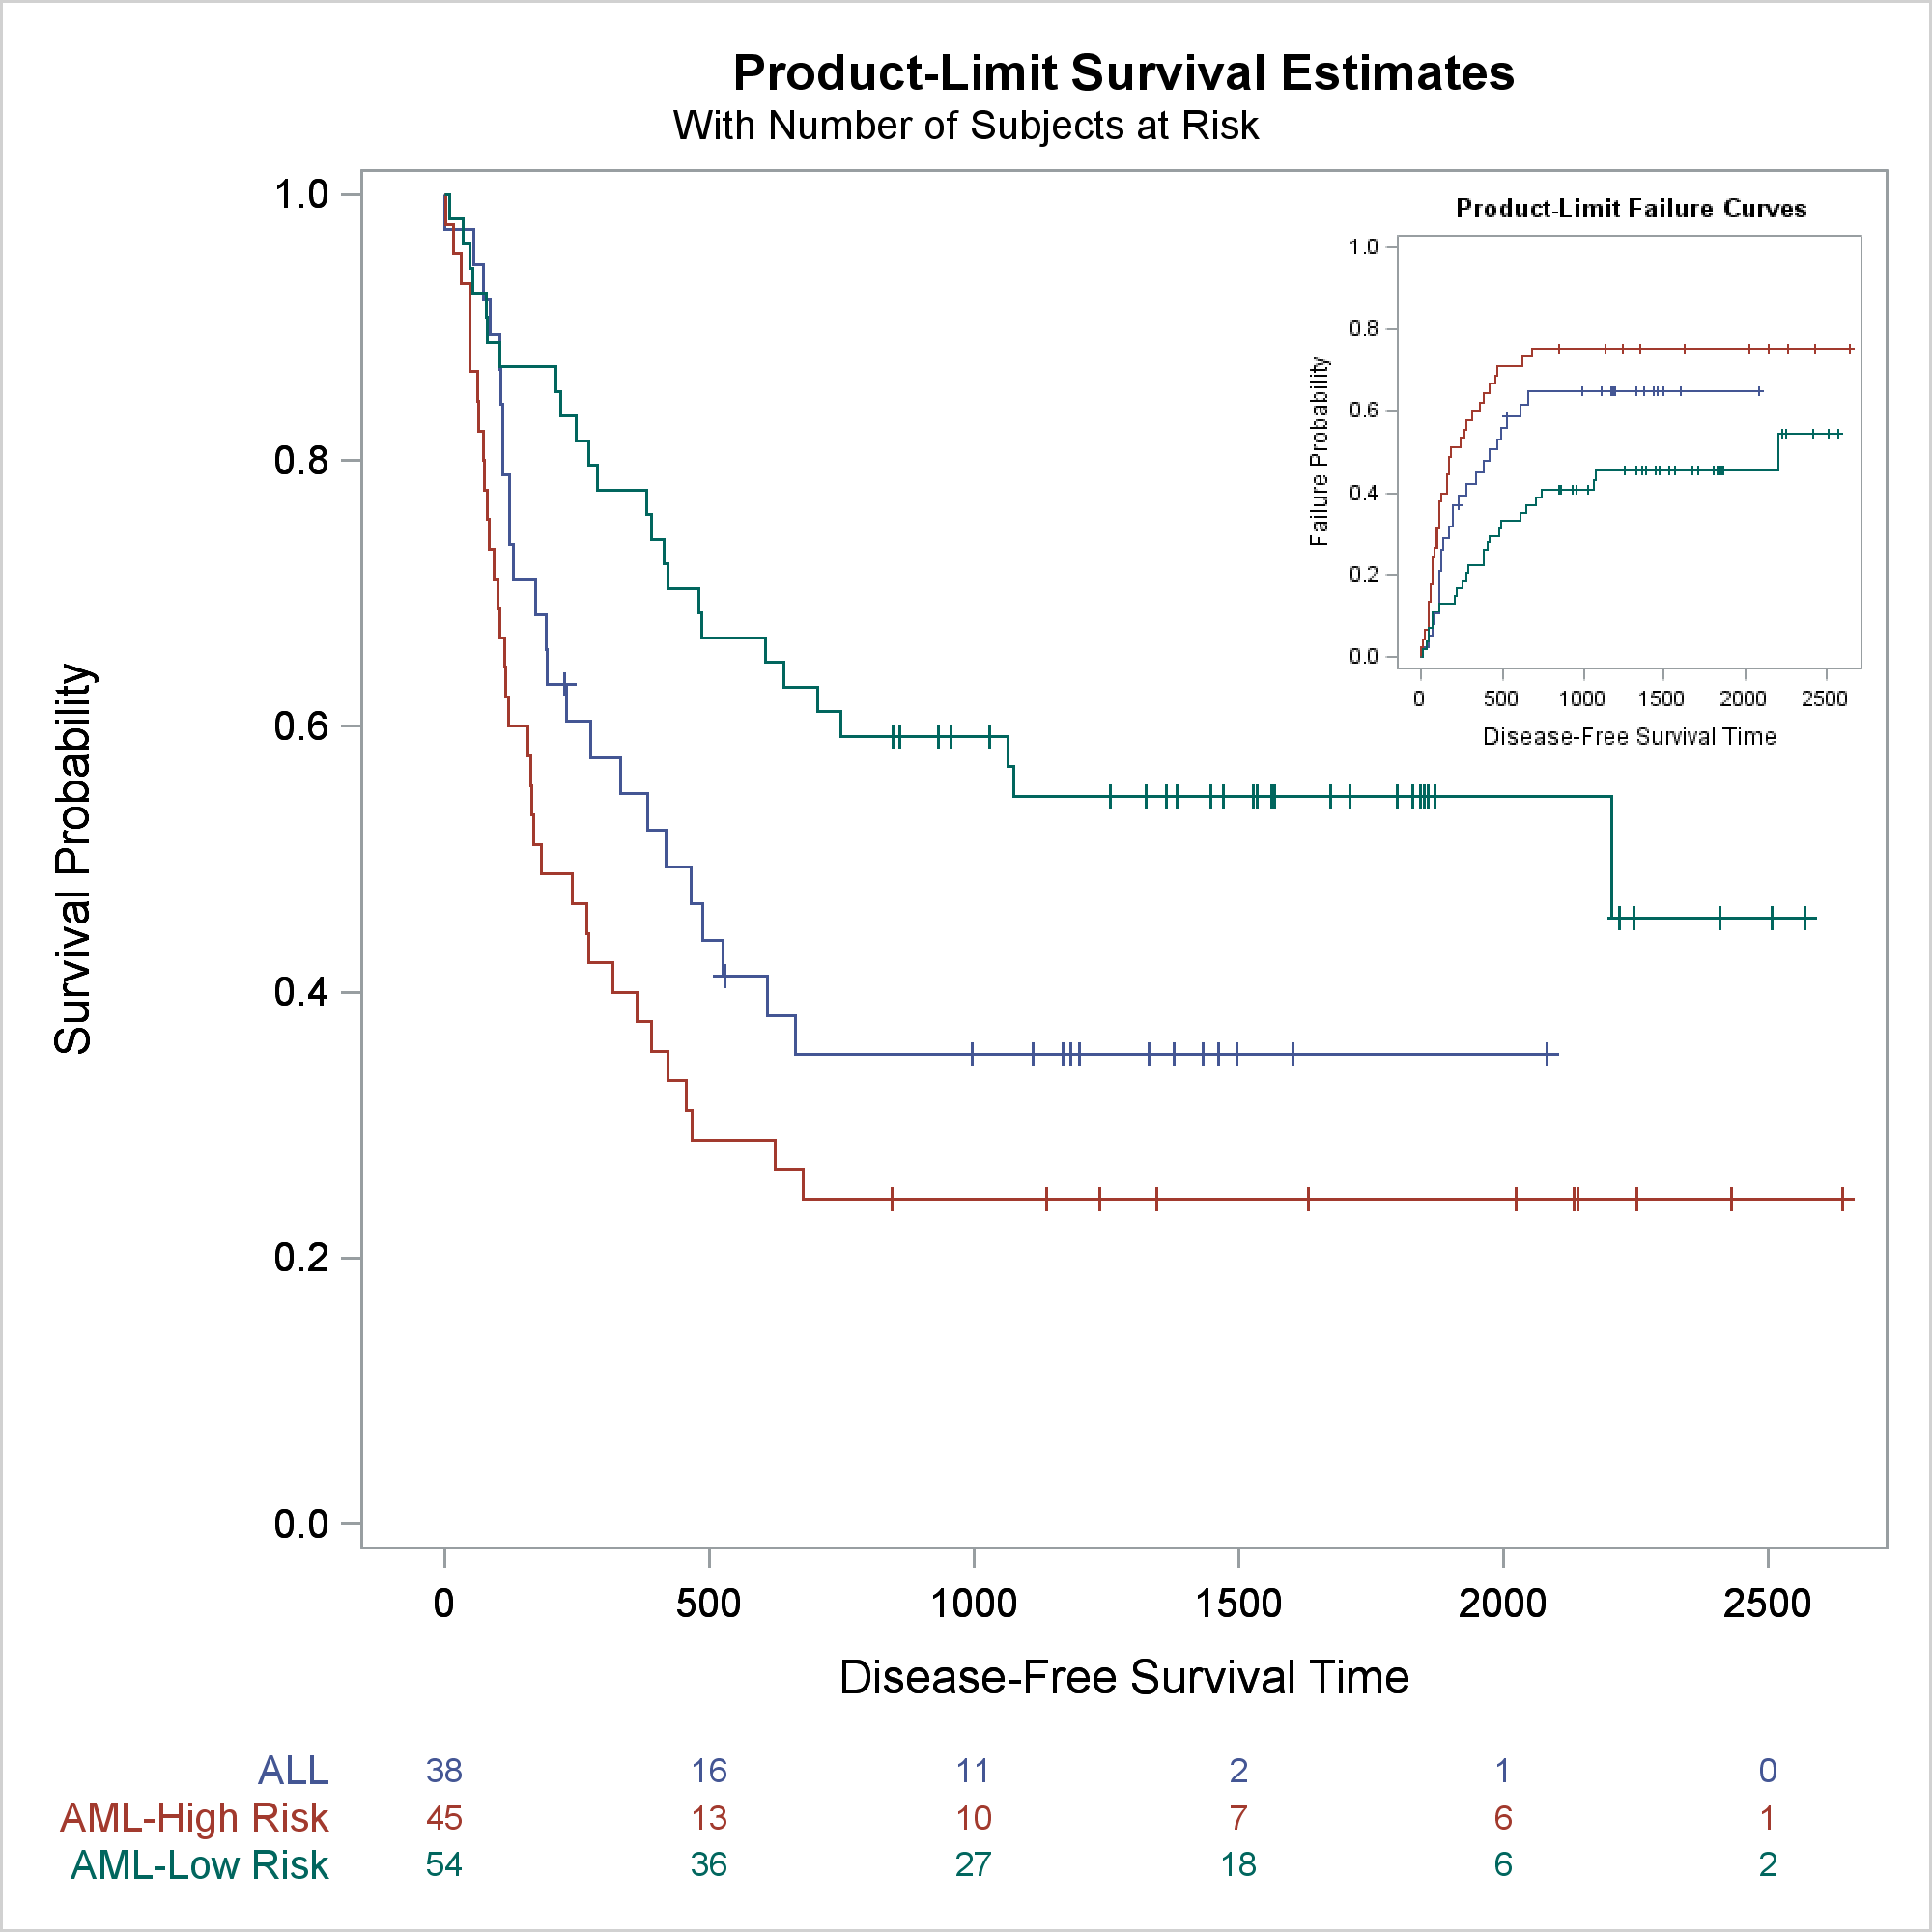
You can use SG Annotation (and its GTL equivalent) to display one graph inside another.

Warren F. Kuhfeld is a distinguished research statistician developer in SAS/STAT R&D. He received his PhD in psychometrics from UNC Chapel Hill in 1985 and joined SAS in 1987. He has used SAS since 1979 and has developed SAS procedures since 1984. Warren wrote the SAS/STAT documentation chapters "Using the Output Delivery System," "Statistical Graphics Using ODS," "ODS Graphics Template Modification," and "Customizing the Kaplan-Meier Survival Plot." He also wrote the free web books Basic ODS Graphics Examples and Advanced ODS Graphics Examples.
You can use SG Annotation (and its GTL equivalent) to display one graph inside another.

This post shows a variety of techniques including how to use PROC TEMPLATE and the SOURCE statement, PROC SGPLOT with multiple Y-axis tables, create comparable axes in two side-by-side graphs, create a broken axis, write and use a table template that wraps text, and find and display examples of certain statements in graph templates and fonts in style templates.
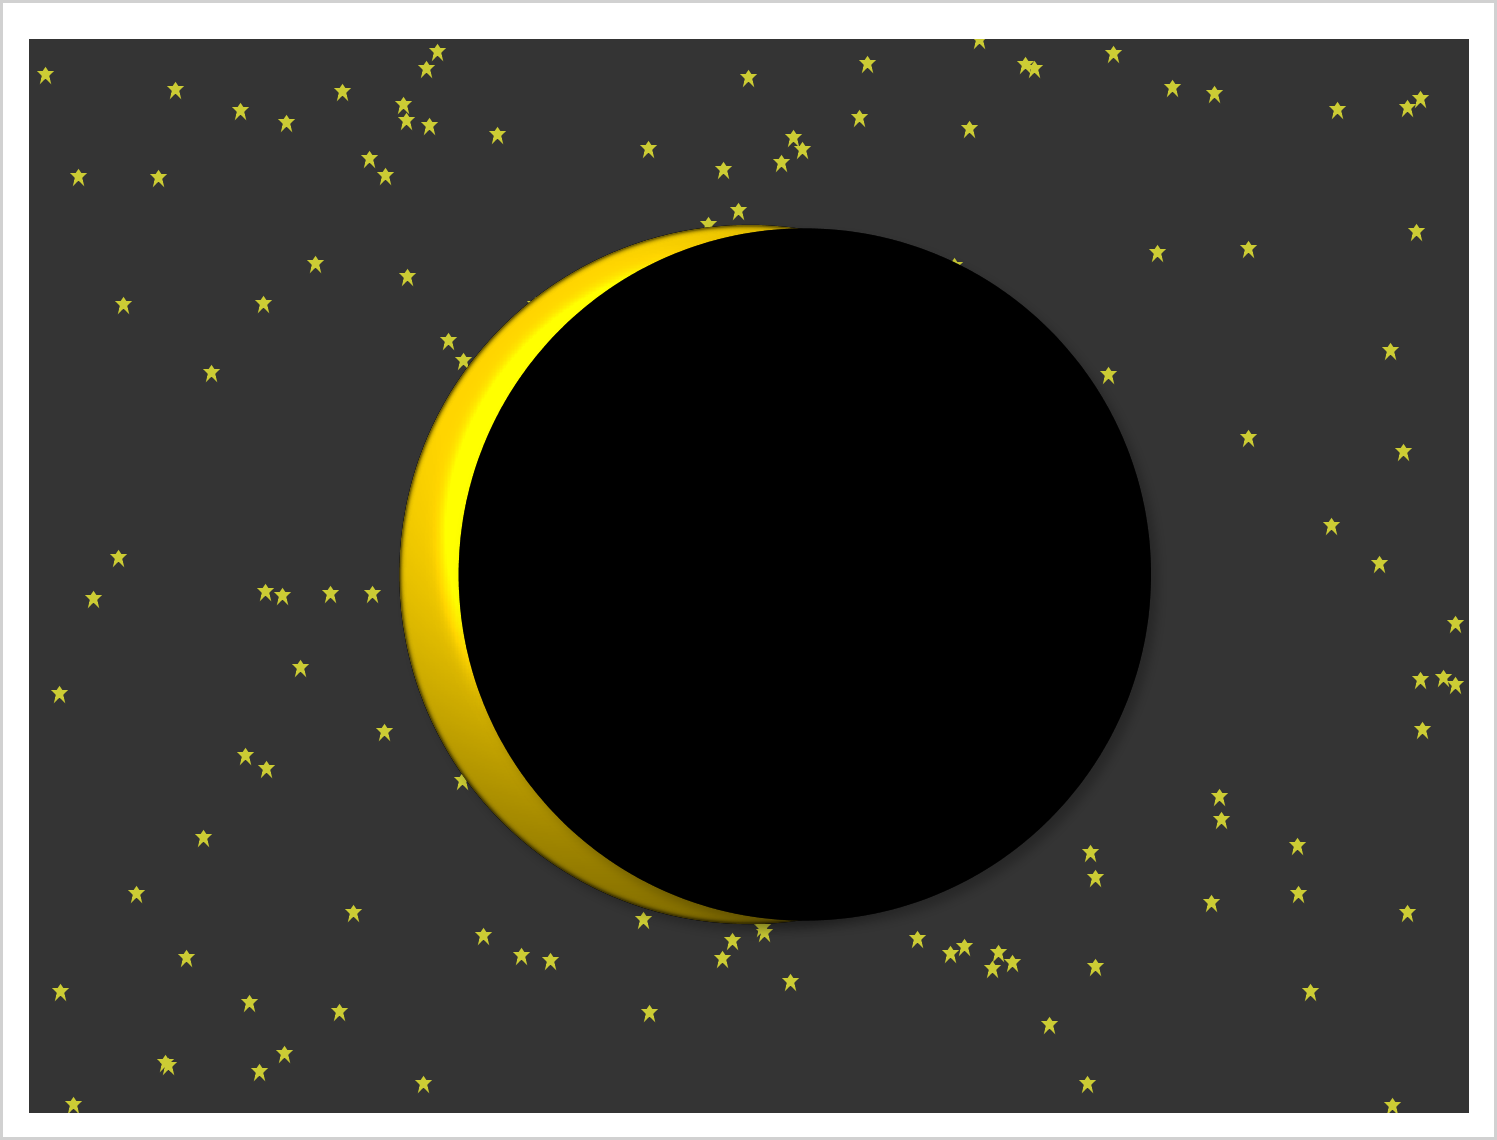
This example shows how to create two coordinated range attribute maps and use them in creating an animated gif of the eclipse.