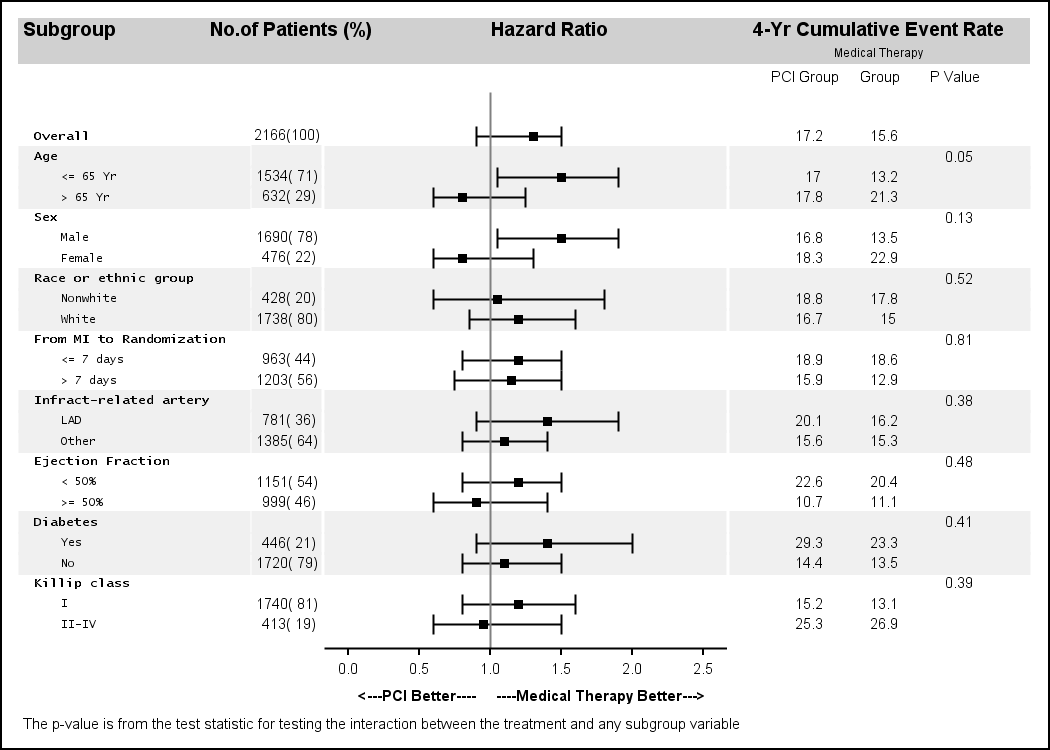
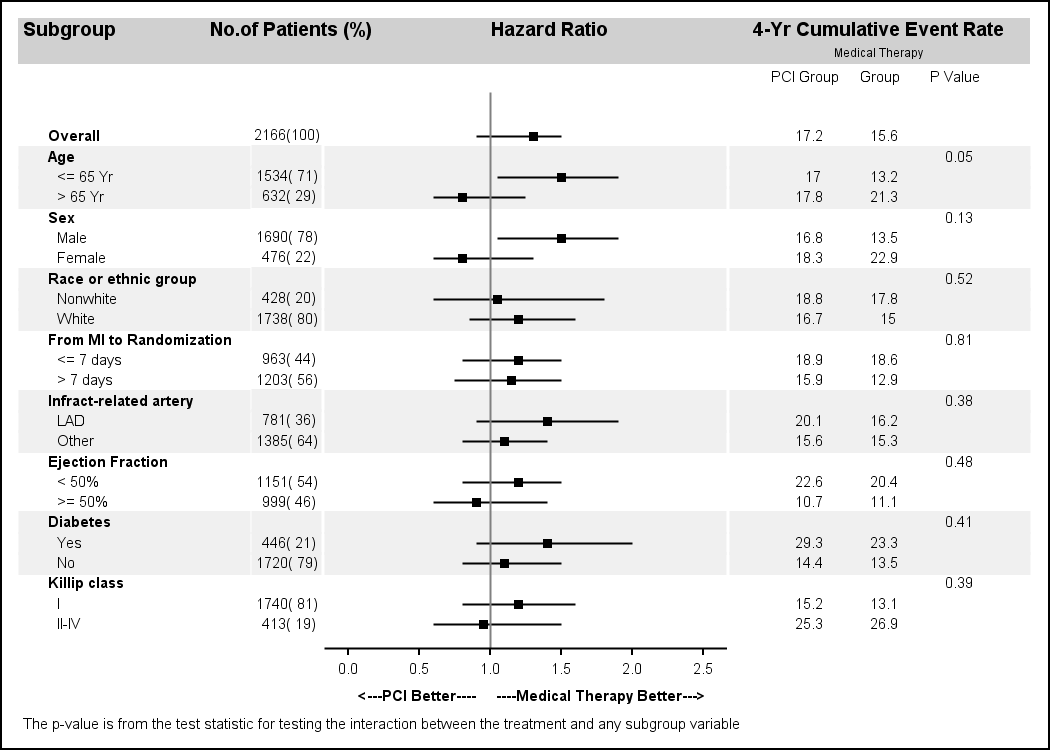
Author

Sanjay Matange
RSS
Director, R&D

Sanjay Matange is R&D Director in the Data Visualization Division responsible for the development and support of the ODS Graphics system, including the Graph Template Language (GTL), Statistical Graphics (SG) procedures, ODS Graphics Designer and related software. Sanjay has co-authored a book on SG Procedures with SAS/PRESS.

Data Visualization
Sanjay Matange 0
Naomi's Graph Makeover Contest

Naomi Robbins has posted a contest, part 1 of which is to submit alternative representations for the following graph: Clearly, usage of two pie charts to represent the share of the B2B and B2C referrals will invite many responses.  To create the graph, I took the data shown in the Pie Charts themselves, so we are using percent

1 75 76 77 78 79 100