Author

Sanjay Matange
RSS
Director, R&D

Sanjay Matange is R&D Director in the Data Visualization Division responsible for the development and support of the ODS Graphics system, including the Graph Template Language (GTL), Statistical Graphics (SG) procedures, ODS Graphics Designer and related software. Sanjay has co-authored a book on SG Procedures with SAS/PRESS.

Data Visualization
Sanjay Matange 0
Is that Annotate?

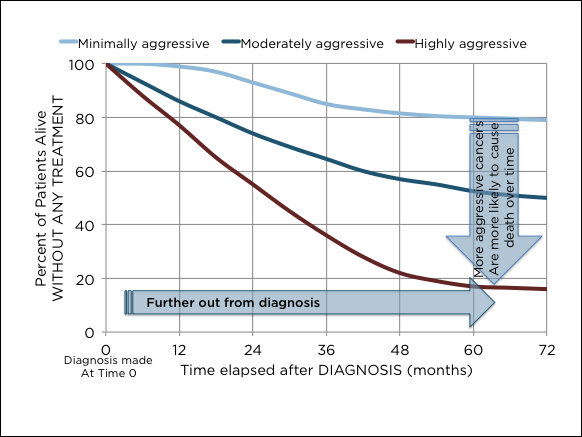
The SGPLOT procedures includes features to add annotations to your graph in many different ways.  Annotations provide you a flexible way to add features to your graph that are not available through the standard plot statements. Recently, I saw this graph on the web that caught my attention.  Clearly, this looks like

Data Visualization
Sanjay Matange 0
Report from PharmaSUG 2015

PharmaSUG 2015 in Orlando was held at the Renaissance had a record breaking attendance of over 650.  Weather was great, except for a huge downpour on the evening of the last day.  All the popular presenters were in attendance including Art Carpenter, Kirk Lafler, Arthur Li and many others. Presentations

Data Visualization
Sanjay Matange 0
Report from SGF 2015

SGF 2015 was a blast with a focus on Visual Analytics, SAS Studio, Hadoop and more.  Graphs were everywhere, and it was a banner year for ODS Graphics with over 15 papers and presentations by users on creating graphs using SG Procedures, GTL and Designer. Dan Heath, Prashant Hebbar, Scott

1 39 40 41 42 43 100