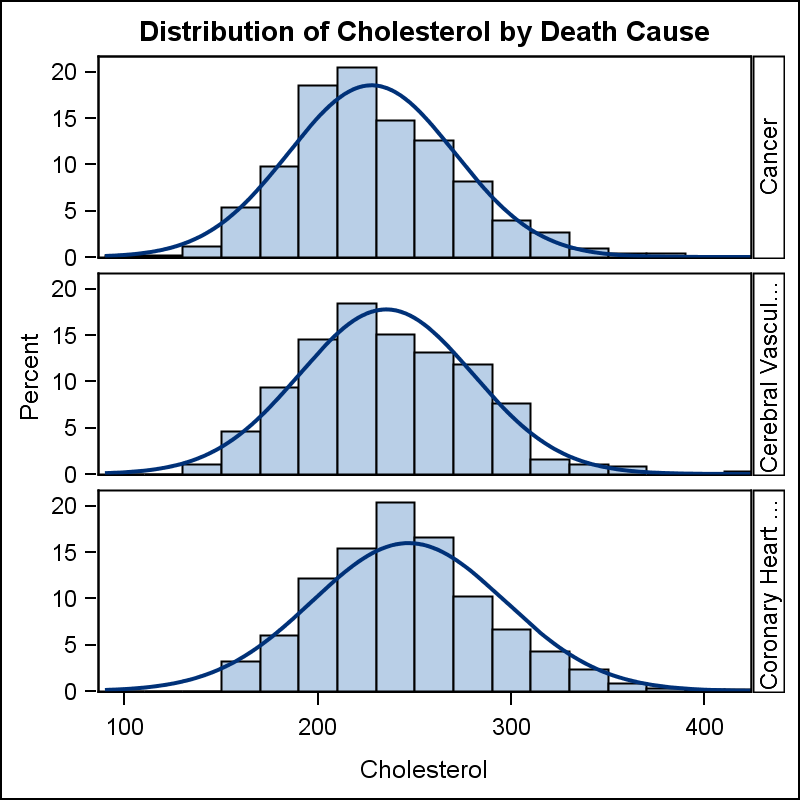
Author

Sanjay Matange
RSS
Director, R&D

Sanjay Matange is R&D Director in the Data Visualization Division responsible for the development and support of the ODS Graphics system, including the Graph Template Language (GTL), Statistical Graphics (SG) procedures, ODS Graphics Designer and related software. Sanjay has co-authored a book on SG Procedures with SAS/PRESS.

Data Visualization
Sanjay Matange 0
Row Lattice Headers

The SGPANEL procedure makes it easy to create graph panels that are classified by one or more classifiers.  The "Panel" layout is the default and it places the classifier values in cell headers at the top of each cell. When using LAYOUT=Latice or RowLattice, the row headers are placed at

Data Visualization
Sanjay Matange 0
Bubble Plots

Bubble Plots provide additional ways to visualize your data.  The plot supports display of multiple response characteristics of the data in one graph.  Bubble plots were introduced with SAS 9.3 in GTL and SG Procedures. A bubble is drawn at each (x, y) point in the graph, and each bubble is

1 38 39 40 41 42 100