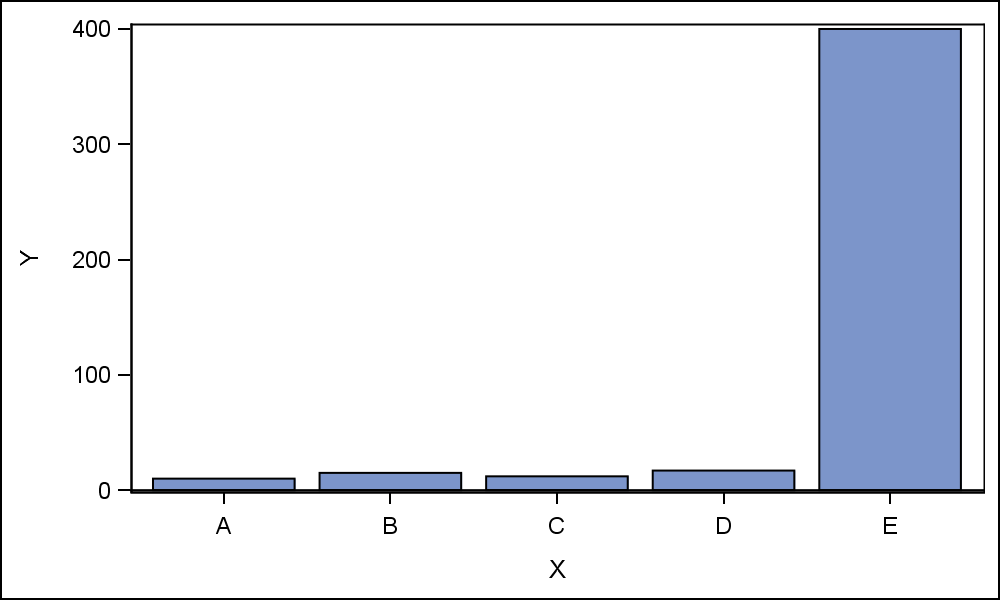
Author

Sanjay Matange
RSS
Director, R&D

Sanjay Matange is R&D Director in the Data Visualization Division responsible for the development and support of the ODS Graphics system, including the Graph Template Language (GTL), Statistical Graphics (SG) procedures, ODS Graphics Designer and related software. Sanjay has co-authored a book on SG Procedures with SAS/PRESS.

Data Visualization
Sanjay Matange 0
Broken Axis Redux

Often when the data includes some extreme difference in measures or some outliers, the plot of the data points can get skewed due to the need to accommodate the extreme outliers.  The bulk of the observations get squeezed into a smaller region of the plot.  While this may be useful

1 36 37 38 39 40 100