Author

Sanjay Matange
RSS
Director, R&D

Sanjay Matange is R&D Director in the Data Visualization Division responsible for the development and support of the ODS Graphics system, including the Graph Template Language (GTL), Statistical Graphics (SG) procedures, ODS Graphics Designer and related software. Sanjay has co-authored a book on SG Procedures with SAS/PRESS.

Data Visualization
Sanjay Matange 0
Axis Customizations

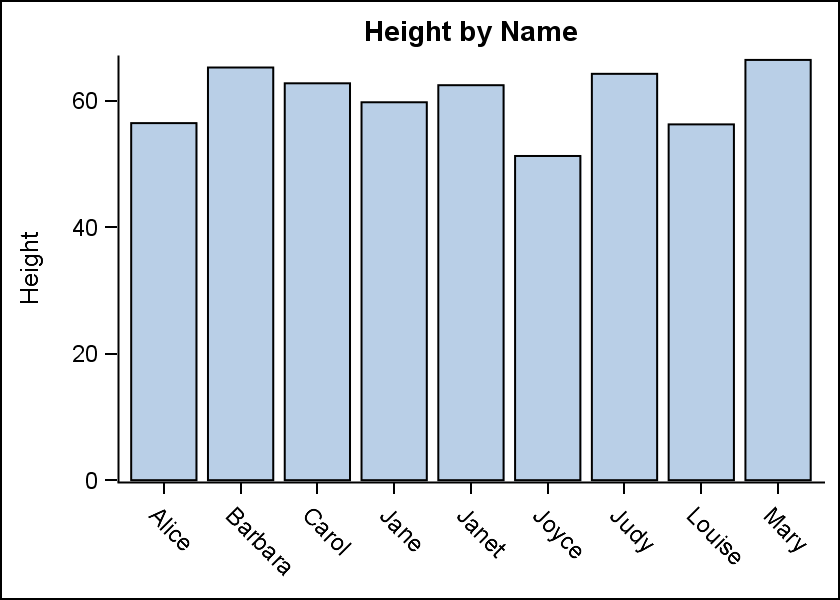
All axis customization features are always welcome.  Especially since SGPLOT statements can often be used to create non standard graphs, having the ability to customize the axes is important.  This article presents ways in which you can customize the discrete axes. By default, the x axis will try to display the

1 35 36 37 38 39 100