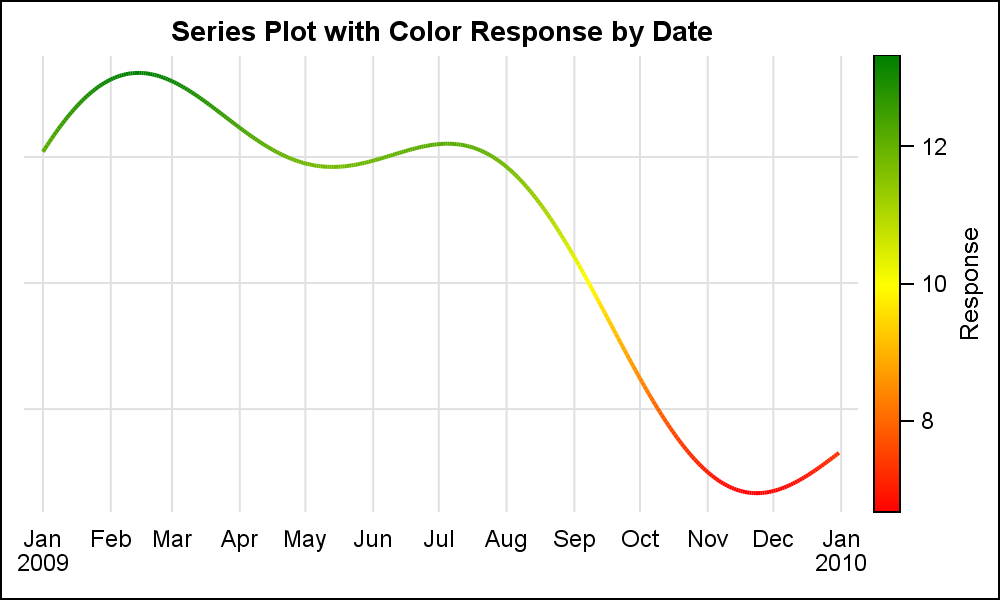
Author

Sanjay Matange
RSS
Director, R&D

Sanjay Matange is R&D Director in the Data Visualization Division responsible for the development and support of the ODS Graphics system, including the Graph Template Language (GTL), Statistical Graphics (SG) procedures, ODS Graphics Designer and related software. Sanjay has co-authored a book on SG Procedures with SAS/PRESS.

Data Visualization
Sanjay Matange 0
Diagrams with curved links

Let us continue with our journey beyond standard plots and charts.  Often we need to create some simple diagrams to visualize the connections between different entities such as patients and providers or even a social network. Many of you may not have a custom tool to create diagrams.  But you have Base SAS, so

Data Visualization
Sanjay Matange 0
Infographics Bar Chart

Last week I posted an article on creating Infographics using SAS.   The interest shown by the SAS community in this topic came as a surprise.  Also, it so happened by coincidence, a SAS users also  called into Tech Support just about the same time with a query about creating  Infographics type graph

1 30 31 32 33 34 100