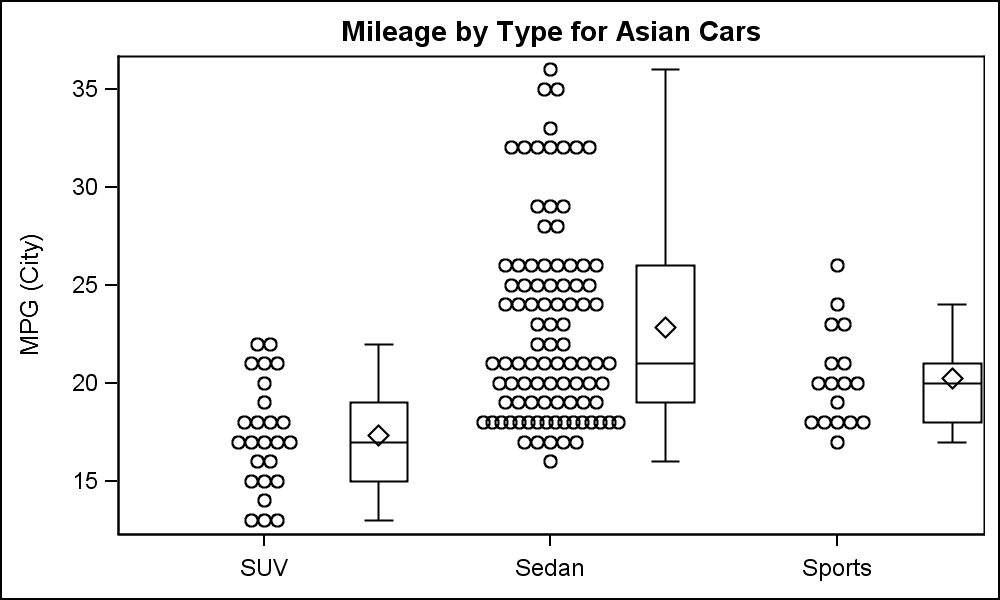
Scatter with box

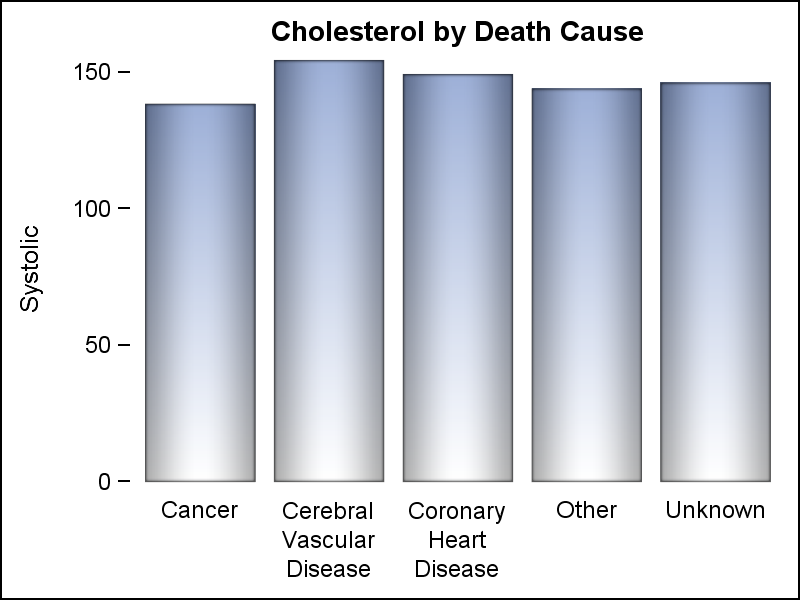
Previously, I discussed ways to create a Box Plot with Stat Table and Markers in the linked article. One of the graphs showed a Box Plot of Cholesterol by Death cause along with the display of the actual observations. The main goal for that article was display of statistics with