Author

Sanjay Matange
RSS
Director, R&D

Sanjay Matange is R&D Director in the Data Visualization Division responsible for the development and support of the ODS Graphics system, including the Graph Template Language (GTL), Statistical Graphics (SG) procedures, ODS Graphics Designer and related software. Sanjay has co-authored a book on SG Procedures with SAS/PRESS.

Data Visualization
Sanjay Matange 0
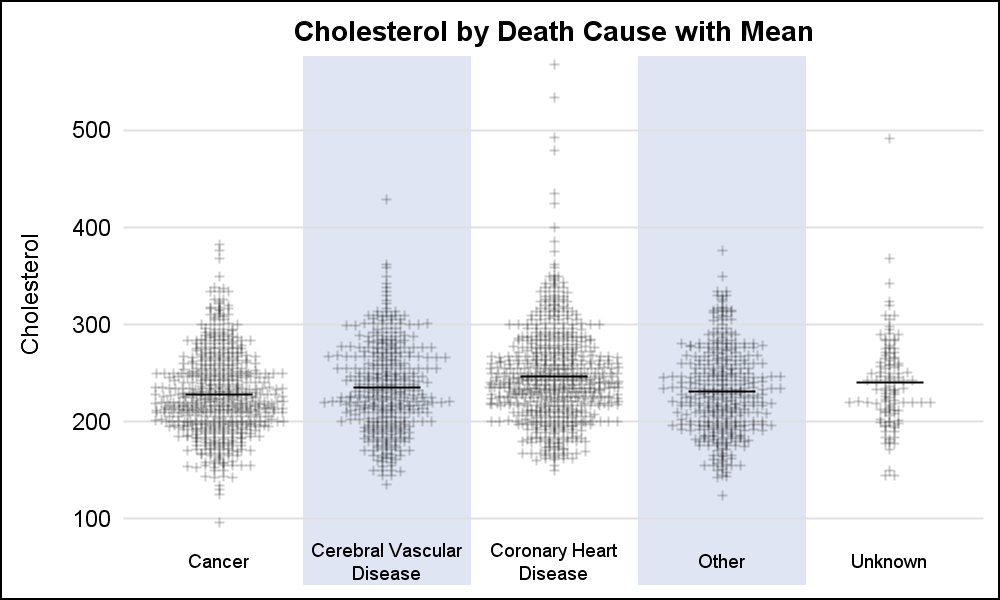
Scatter with mean value

A frequently requested statistical graph is the scatter plot by with discrete categories along with mean value for each category.  Searching for a "Scatter with Mean" will return a lot of requests for such a graph in SAS, Stata, R and other statistical software. Such a graph is very easy

Data Visualization
Sanjay Matange 0
Category highlighting

When presenting information in form of a graph we show the data and let the reader draw the inferences.  However, often one may want to draw the attention of the reader towards some aspect of the graph or data.  For one such case, a user asked how to highlight one

1 13 14 15 16 17 100