Tips and Tricks: Show first N bars

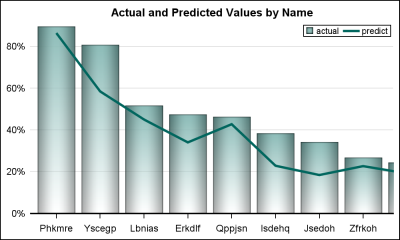
Often we have a graph with many bars (or categories) on the x or y axis. These categories may be sorted by descending response such as frequency of a % value. An example with simulated data is shown below. title 'Actual Values by Name'; proc sgplot data=bars2 noborder; vbar name /