
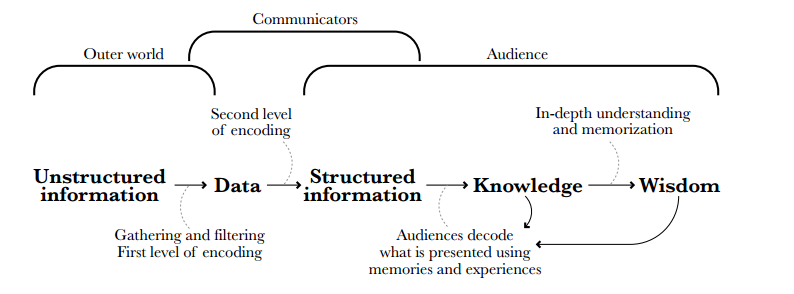
Data Visualization: From Information to Wisdom

How often does a graph change the world? In 1854, Doctor John Snow produced a map to plotter cholera cases by drawing on a London map a bar for each reported death. Until then, it was believed that cholera was spread by miasma in the air, however, transmission method has