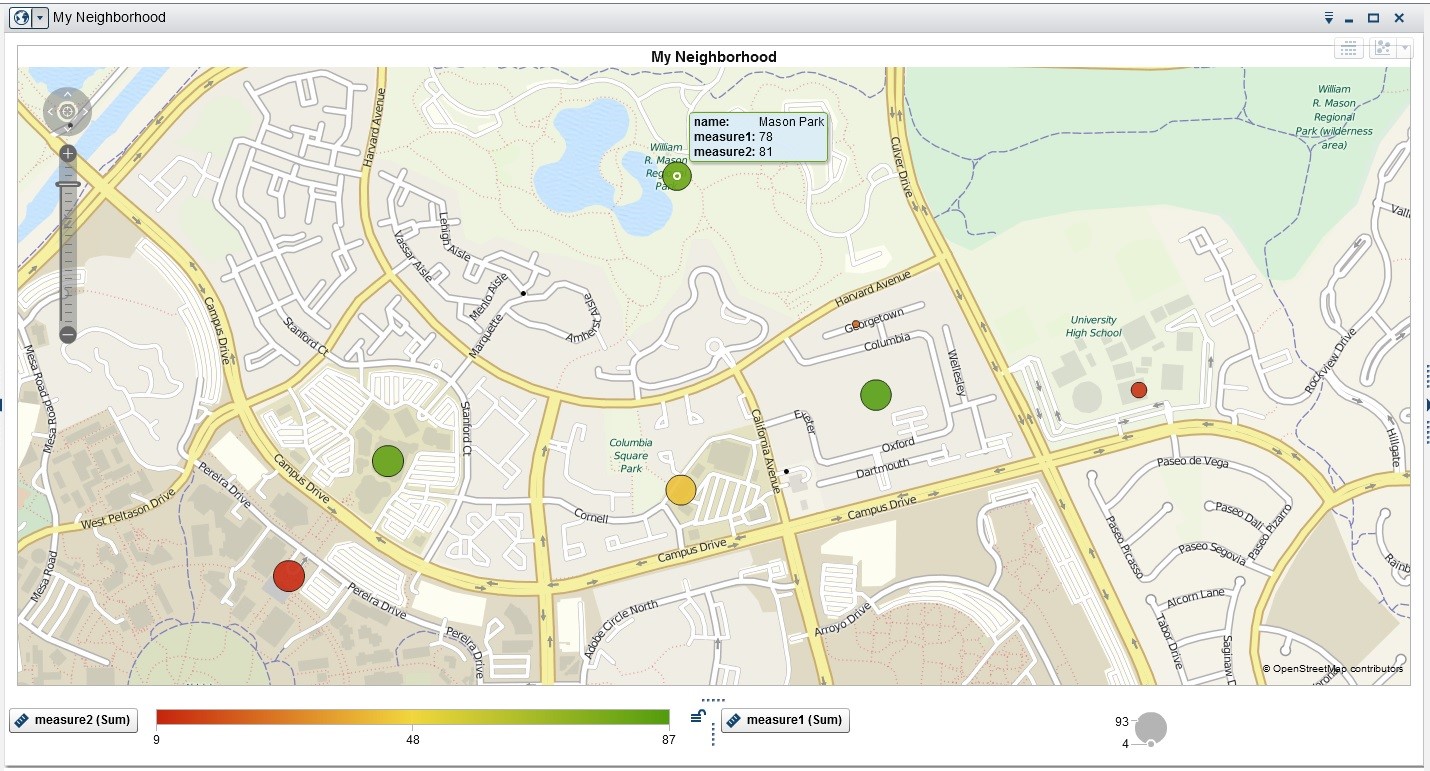
The Geo Map Visualization has several built-in geographical units, including country and region names and codes, US state names and codes, and US zip codes. You can also define your own geographic units. This paper describes how to identify any geographic point of interest, or collection of points, on a map to create custom maps in SAS.
Author
Datasets can present themselves in different ways. Identical data can bet arranged differently, often as wide or tall datasets. Generally, the tall dataset is better. Learn how to convert wide data into tall data with PROC TRANSPOSE.
Do you periodically delete unneeded global macro variables? You should! Deleting macro variables releases memory and keeps your symbol table clean. Learn how the macro language statement that deletes global macro variables and about the %DELETEALL statement that can be a life saver for macro programmers.
Here's a Proc Print trick for grouped data. Suppose your data is divided into groups, such as males and females. You could sort by the grouping variable before printing, like this: Suppose you want to better emphasize the groups. You could add a BY statement, like this: OK, but, personally,
Suppose you want a list of car manufacturers from the CARS dataset. Easy! Call the %CHARLIST macro from a %PUT statement, like this: The CHARLIST macro generates a list of unique values of a selected variable from a selected dataset. So does PROC FREQ. But, if you don't need statistics, the CHARLIST
Would you like to format your macro variables? Easy! Just use the %FORMAT function, like this: What?! You never heard of the %FORMAT function? Of course not, cuz it doesn't exist! No problem. Just create it, like this: %macro format(value,format); %if %datatyp(&value)=CHAR %then %sysfunc(putc(&value,&format)); %else %left(%qsysfunc(putn(&value,&format))); %mend format; The %FORMAT
In a previous blog, Random Sampling: What's Efficient?, I discussed the efficiency of various techniques for selecting a simple random sample from a large SAS dataset. PROC SURVEYSELECT easily does the job: proc surveyselect data=large out=sample method=srs /* simple random sample */ rate=.01; /* 1% sample rate */ run; Note:
Suppose you wish to select a random sample from a large SAS dataset. No problem. The PROC SURVEYSELECT step below randomly selects a 2 percent sample: proc surveyselect data=large out=sample method=srs /* simple random sample */ n=1000000; /* sample size */ run; Do you have a SAS/STAT license? If not,
This post is the third and final in a series that illustrates three different solutions to "flattening" hierarchical data. Don't forget to catch up with Part 1 and Part 2. Solution 2, from my previous post, created one observation per header record, with detail data in a wide format, like
This post is the second in a series that illustrates three different solutions to "flattening" hierarchical data. Solution 1, from my previous post, created one observation per header record, summarizing the detail data with a COUNT variable, like this: Summary Approach: One observation per header record Obs Family Count
A family and its members represent a simple hierarchy. For example, the Jones family has four members: A text file might represent this hierarchy with family records followed by family members' records, like this: The PROC FORMAT step below defines the codes in Column 1: proc format; value $type
When reading a text file (common extensions: TXT, DAT; or, for the adventurous: HTML) with the DATA STEP, you should always view several lines from the text file, and compare to the record layout, before completing the INPUT statement. There are many ways to view a text file. I use
Default PROC FREQ output looks like this: Suppose you don't want the two cumulative statistic columns above. No problem. Those can be suppressed with the NOCUM option on the TABLE statement, like this: proc freq data=sashelp.shoes; table product / nocum; run;
Dataset too big for PROC PRINT? One weird trick solves your problem! proc print data=bigdata (obs=10); run; The OBS= dataset option specifies the last observation to process from an input dataset. In the above example, regardless of dataset size, only the first 10 observations are printed; an easy way to
A student in a SAS class recently asked if there were a way to eliminate data error notes from the SAS log and, instead, write them to a separate file. Of course there's a way! Here's a simple datastep. Notice the missing dollar sign to indicate the variable GENDER (M,
Sometimes, your first impulse may not be correct, like trading in your practical sedan for a hot 2-seater. Other times, your first impulse is perfect, as in the examples below. Suppose the automobile data you wish to analyze resides in a CSV file. Naturally, your first impulse is to import
Suppose you have an old jalopy that's perfectly reliable. Your jalopy gets you where you wanna go: no frills; no drama. Do you trade your old wheels in for a racecar that accelerates like crazy and corners like it's on rails? Or stick with what's old and comfortable? Your choice