Update Data Live in SAS Viya: Integrating SAS Code with Interactive Reports

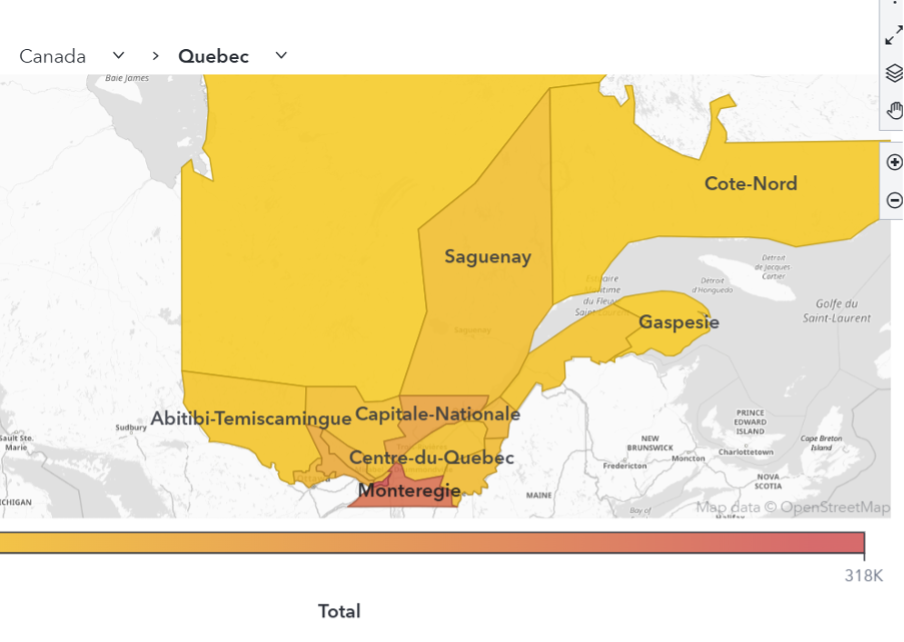
In SAS Viya 4, we can embed inputs directly on the reporting page with live results. These reports have code that takes user inputs and runs the program, which will run the dataset and update it with the most recent data. This gives the user the ability to create datasets