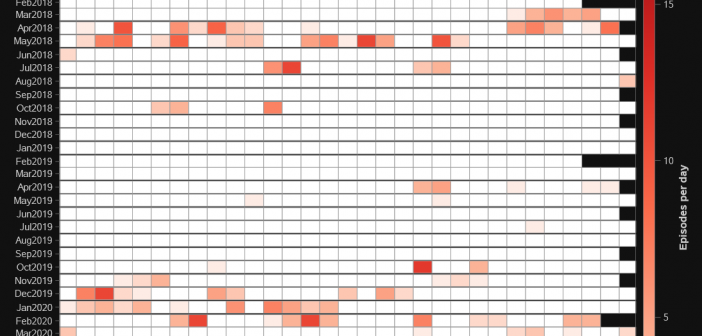
Over 57 billion minutes of The Office was streamed in 2020. My family bears some responsibility. Here's our activity visualized -- using SAS.
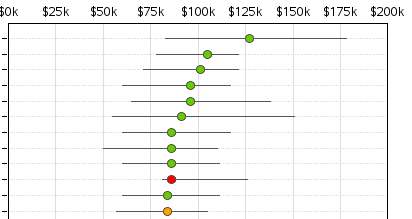
On his SAS and R blog, Ken K. recently posted an example of a visualization technique called "small multiples". In this exercise, Ken shows the programming technique for replicating a particular series of pie charts in R as well as in SAS. It's a useful exercise to learn from, but