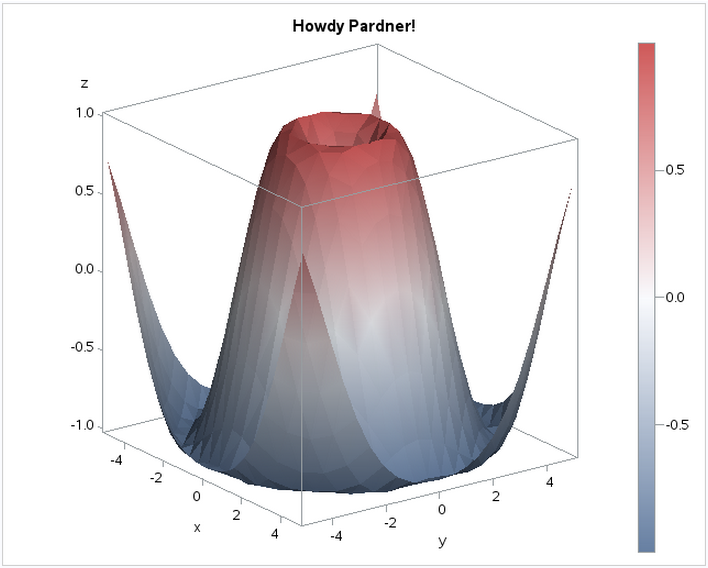
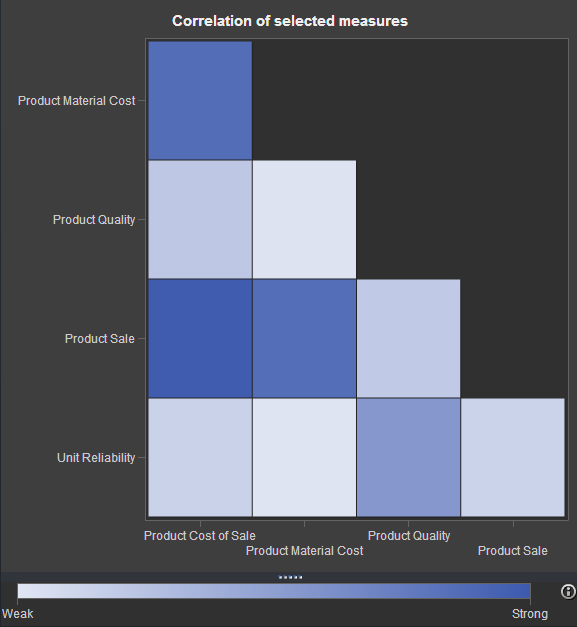
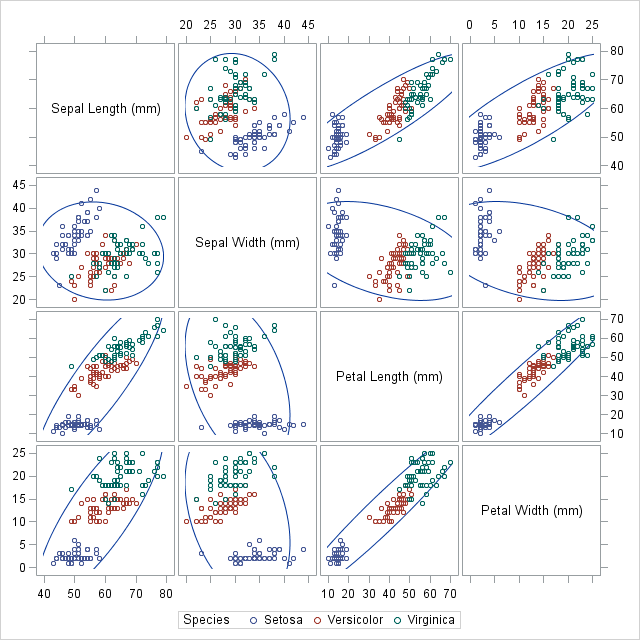
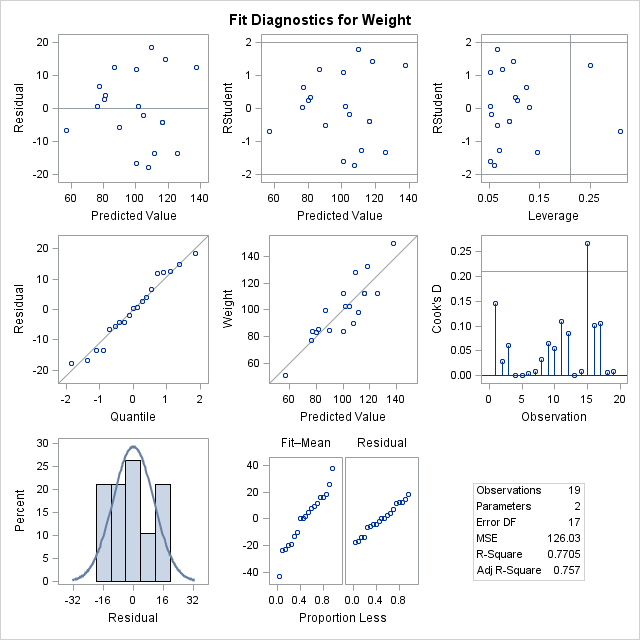
SAS Community member @tc (a.k.a. Ted Conway) has found a new toy: ODS Graphics. Using PROC SGPLOT and GTL (Graph Template Language), along with some creative data prep steps, Ted has created several fun examples that show off what you can do with a bit of creativity, some math knowledge,
Tag: ODS Graphics
Rick Wicklin created a nice example of using the SURFACEPLOTPARM statement to create a surface plot in SAS. As I read it, the question that immediately came to mind was: can I use this to create the famous SAS cowboy hat? The "cowboy hat" is a highly distributed example of
If you've watched any of the demos for SAS Visual Analytics (or even tried it yourself!), you have probably seen this nifty exploration of multiple measures. It's a way to look at how multiple measures are correlated with one another, using a diagonal heat map chart. The "stronger" the color
You can still get a paper proposal in for SAS Global Forum 2012. All you need is an idea. And probably some data. And also, some techniques for analyzing that data. Oh, and some conclusions would be helpful as well. I know: you are a busy person! You might not
We ship many sample data sets with SAS products. By using well-understood sample data sets, we can teach concepts or show off product features without distracting the audience/students with data collection or prep. At least, that's the way it's supposed to work. But occasionally the sample data can cause a
One of the great innovations with SAS 9.3 is the focus on ODS statistical graphics. "Wait a minute," you're thinking, "weren't ODS graphics added in SAS 9.2?" Yes, that's true. But with SAS 9.3 there is even more capability: more analytical SAS procedures support the graphs, and there are more
Rick Wicklin created his own list of Five Interface and Graphics Features that Everyone Can Use. It's a very good summary of what you'll immediately notice when you use analytics procedures in SAS display manager: cool graphs turned on by default. For SAS Enterprise Guide users, you won't see such
The ODS Graphics Designer allows you to design and build your own statistical graphs in SAS, without having to learn how to program in the new graph template language (GTL). The ODS Graphics Designer is a rich user interface that allows you to design these graphs based upon your own
Last week I talked about how I volunteered to serve as a judge for a middle-school science fair. As I expected, I enjoyed the experience quite a bit, and I hope the students got something positive from me as well. I evaluated several really impressive projects at the 7th grade
Here at SAS, we eat our own dogfood*. Actually, that's an understatement -- it's better to say that we feast on it. I've been using SAS 9.2 (released earlier this year) and SAS Enterprise Guide 4.2 (not yet released) for many months (years, actually) to accomplish several tasks, including to