Why visualization? Several reasons, actually, the most compelling being that sometimes visualization literally solves the problem for you.
I remember an exercise in eighth grade English class where we were asked to describe, in words only, an object set in front of us with sufficient clarity such that our classmates, sequestered outside the room, could accurately draw the object from our written description. The object was a bowtie shaped set-top UHF antenna.
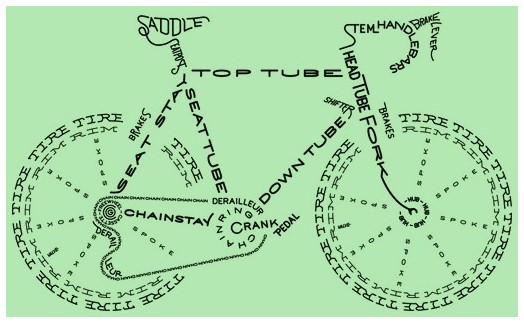 The exercise was a disaster. Which of course was the objective, at least from the teacher's perspective, who was attempting to demonstrate how difficult clear, comprehensible writing can be. From our perspective, however, all we could focus on was what idiots the recipients of our written descriptions must have been. “Why did you draw the loops at right angles to each other when I clearly indicated they were in the same plane as the base?” Looking back, had I been clever enough, I realize now that I should have “cheated” and used a typographical approach to illustrate the object diagrammatically with my otherwise 'descriptive' words.
Live and learn. But what did I learn? Not so much that I needed to be a better writer, no, what I learned was that often the situation simply calls for you to skip the words altogether and go straight to a visualization / diagram. Visualization makes for better communication.
In a famous paper from 1987 by Larkin and Simon entitled, “Why a Diagram is (sometimes) Worth Ten Thousand Words”, the authors open with the observation that humans can not only take multiple cognitive approaches to problem solving, but that there are different modes of information representation – diagrammatic and non-diagrammatic - each with their own strengths and weaknesses.
Daniel Kahneman, in his lifelong studies in psychology, summarized in his popular 2001 book, “Thinking, Fast and Slow”, which I discussed in this previous post (“WYSIATI”), builds on this concept with his System 1 and System 2 modes of thought, with System 1 being automatic, intuitive, and often visual. Visualization isn’t just a tool for decision making, it is a way of thinking, a method of reasoning unto itself.
And we’re actually quite good at this. Compared with the most powerful computers we have today, we are orders of magnitude faster and more accurate at pattern recognition. We can recognize the face of someone we haven’t seen since high school, maybe decades ago, even though they’ve grown a beard or changed their hair and eyeglasses since then. A child can play the “Which of these is not like the other” game as if it were, well, child’s play.
Yes, it’s true, we occasionally get fooled by optical illusions and the like, and I won’t even get into the unreliability of eyewitness testimony, but by and large, visual thinking serves us quite well.
Analytic visualization tools combine the best of both the computer and human worlds, with computers handling the difficult, System 2 calculations and memory functions behind the scenes, relieving our brains of the computational load and leaving its resources free to do what it does best - pattern recognition (for another seminal paper on the topic, check out this one by George Miller: “The Magical Number Seven, Plus or Minus Two – Some Limits on our Capacity for Processing Information”).
The apex of this combination of visualization, pattern recognition and System 1 thinking is the uncanny frequentness of visualization solving the problem directly. Take this example:
There are six roads in Windsor County. You can get to East Windsor from Robbinsville via Allentown. You can get to Bordentown from Allentown via Yardville. Lastly, you can get to East Windsor from Yardville via Robbinsville. That’s all the information you need to know to answer these three questions:
- How many towns are connected to three other towns?
- How many towns are connected to only two other towns?
- How many towns do you pass through going from East Windsor to Bordentown?
If you are like most people, while you could have represented this information non-diagrammatically, such as by writing some Python code, instead you likely simply mapped this out on a piece of paper, and with no further mental exertion, were able to rattle off the answers effortlessly (3, 1 and 2, via two different routes).
Visual analytics not only gives you System 1 thinking on steroids, it combines it with the behind-the-scenes System 2 information processing and calculating that we’re not so good at. Millions, even billions of rows of data. Dozens of variables to explore, and dozens of visualization techniques to choose from. If a bar chart distribution doesn’t scream the solution out to you, you can always flip instantly to a heat map, a regression, a bubble chart, a trend line or a geographic map – whatever’s appropriate.
- Which stores/regions/distributors sell the most product A? The least?
- Which customers always buy products A and B together?
- Which product categories respond best to discounting? Which to prime time TV ads?
- Is there a pattern to defects by production line? By component supplier? By shift?
Unlike with my eighth grade English assignment, visualization is not cheating. Instead, it’s the most direct path to clear communication and rapid insight and understanding. You’re good at this pattern recognition stuff – play to your strengths.