“Here comes Chicago. 17 seconds, 17 seconds from Game 7 or from Championship number 6. Jordan open. Chicago with the lead”. These words from a TV commentary describe Michael Jordan 's crucial shot in game 6 of the NBA Finals 1997/98 between the Chicago Bulls and Utah Jazz, which probably left many eight-year-old boys dreaming of playing in the championship one day.
The NBA dream was not for me, with a body size of 1.80 m. But I have continued to be fascinated by a player who just seemed to get better under pressure. My colleagues Rick Wicklin and Robert Allison have shown how the throwing position of the basketball player Steph Curry affects his accuracy. Let us now take a look at two of Michael Jordan's seasons, 1996/1997 and 1997/1998, and see whether and how his hit rate was affected by pressure.

Lots of data to analyze
In its Shotchart, the NBA provides throwing statistics for individual players, including throwing positions on the field. It also provides access to so-called “play-by-play” details (“Get Game”), which set out the individual actions in a game and the overall game situation. By linking the two data sources, we can derive some indicators about Jordan’s performance under pressure, for example, whether a player’s score was close (eg a maximum of five points behind or lead) or whether the game was close to the end. For the purposes of the analysis, we will define the final phase of a game as pressurized if the difference between the two teams was less than 5 points.
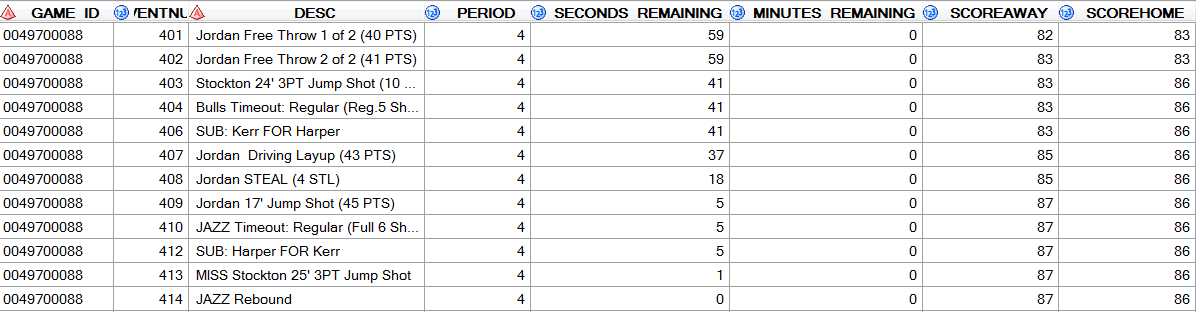
Figure 1: Last minute of the NBA Finals 1997/1998
Calculation of the hit rate under pressure
The aim of predictive modeling is to create a model that makes it possible to calculate and forecast accurately the values of a target or probabilities for events based on input factors (eg distance, angle, remaining time, score).
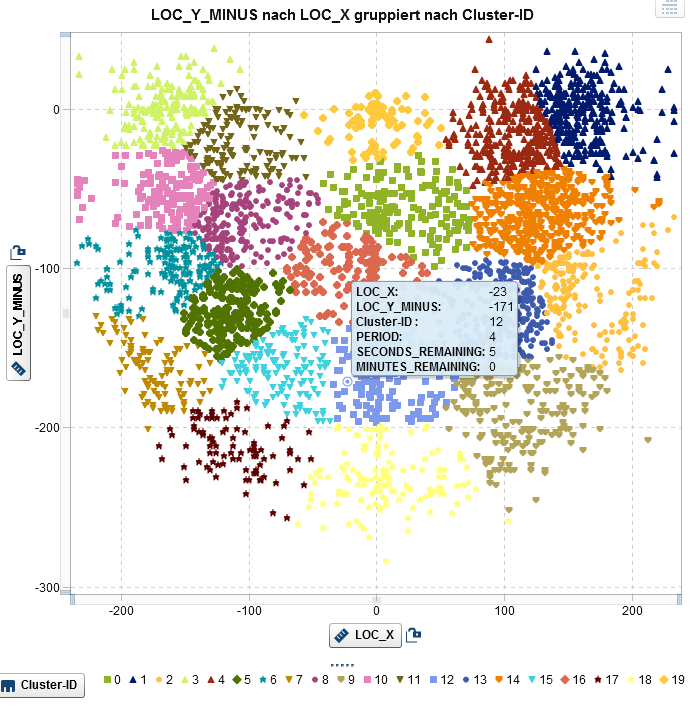
The logistic regression allows the estimation of the influence of pressure conditions on the so-called log-odds ratio. It is therefore possible to identify whether Jordan's scoring success changes under pressure, and also whether it varies, for example, depending on his position on the playing field or the type of shot (for example, Hook Shot vs. Jump Shot). A simple way to take the throwing position into account is to divide the playing field into individual segments. We therefore divided the playing field into 20 clusters using k-means. Outliers (throws of more than 30 ft) were excluded. The individual segments can be integrated into the model as input factors.
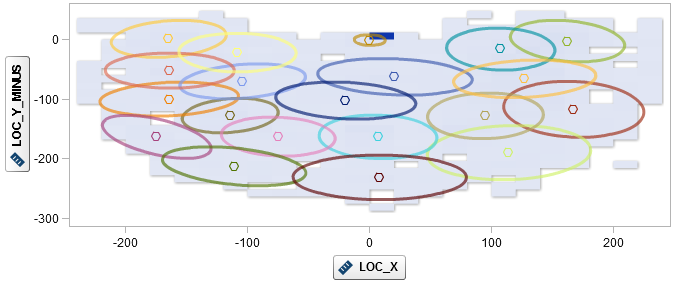
Figure 2: Jordan’s throwing tests in the 1996/1997 and 1997/1998 season
The simple logistic regression model shows that the type of throw and the position on the playing field are significant influencing factors for Jordan’s scoring success. On the other hand, his accuracy does not vary towards the end of the game or when the score is very close. We can therefore assess whether and how pressure on Jordan's hit rate could be an interaction between close games and the last few minutes of a game.

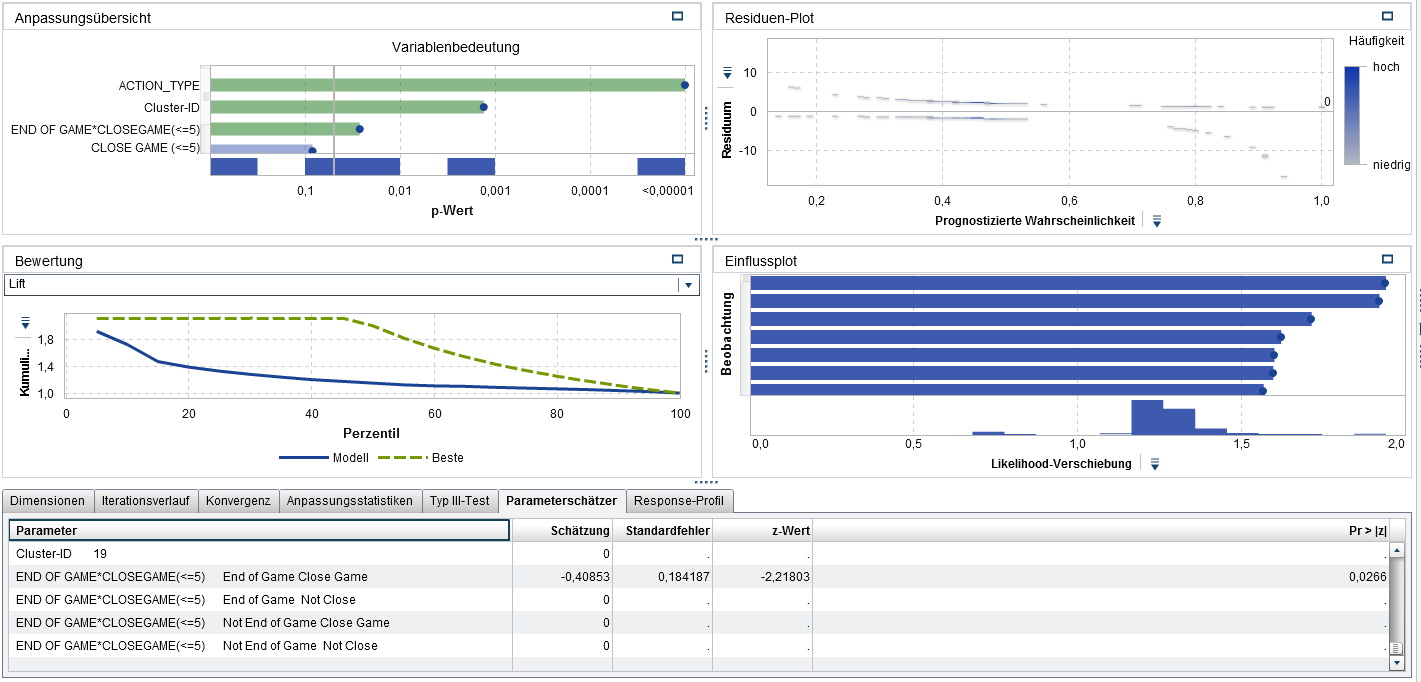
So how does pressure influence Jordan's performance? The parameter estimator is −0.41, a significant shift from zero. If we look at throwing position and shot, our model suggests that Jordan has a declining hit rate towards the end of the game when the score is close. How should we interpret this? In logistic regression, the effect on the hit probability depends on the level of the input factors. Let's take the last shot as an example. Our model predicts a probability of about 36% that the ball lands in the basket. A shot in the same circumstances (a jump shot in field segment 12 towards the end of the game) with a distance of more than 5 points is assigned a probability of 45%.
How robust is the model? Modeling by a General Additive model using SAS/STAT using the PROC GAMPL provides similar results. Other robustness tests, of course, require different definitions of pressure.
Can we conclude from these results that Jordan should not have been given the ball at “crunch times”? No. On the one hand, we have probably missed some potentially important explanatory factors out of the model. For example, opposing teams could have "doubled" (defended with two players) in important situations, which could lead to a lower hit rate. It also does not matter whether Jordan was better or worse under pressure, but whether he was the best option for the decisive shot. And of course, we have not analysed how well Jordan's team-mates Harper, Pippen, Rodman and Kerr managed under pressure.
Jordan probably puts it best: “I’ve missed more than 9,000 shots in my career. I’ve lost almost 300 games. 26 times, I’ve been trusted to take the game winning shot and missed. I’ve failed over and over in my life and that is why I succeeded.”
If you are interested to read more about why sports analytics has broader relevance, have a look at Christer Bodell's post Why Sports is the ultimate arena for Analytics.
