Tag: YAxis

Data Visualization
Sanjay Matange 21
Broken Axis

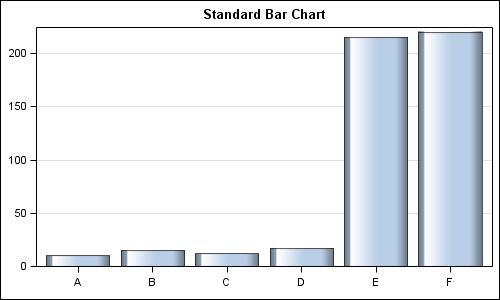
In my previous post I described the new Polygon plot statement that is included with the SAS 9.4M1 release.   So, a valid question is - what is my motivation for discussing the new features in SAS 9.4M1 when most users are at SAS 9.3 or SAS 9.2 versions?  Here are a

Data Visualization
Sanjay Matange 2
Axis values and hint

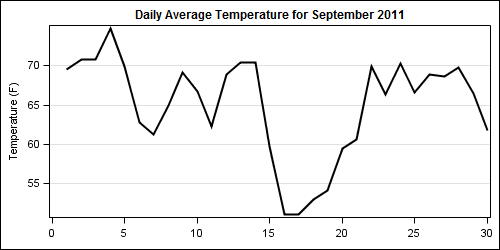
Getting the axis values just right generally requires some work, and the values you want can change from case to case.  One such example was discussed by Dan Heath in his post on custom axis values.  Here Dan shows the usage of non uniform axis values using the VALUES option on

Data Visualization
Sanjay Matange 2
Simply useful

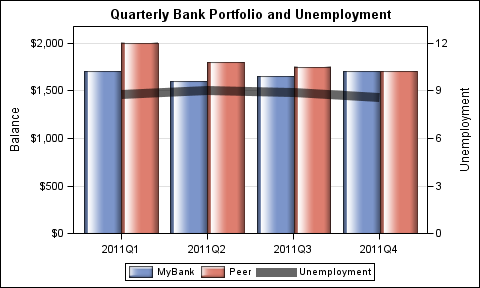
Let us ring in the new year with something simple and useful. A recent question by a user over the holidays motivated this article on what is likely a commonly used graph.  We want to compare the preformance of two categories along with a third measure.  This could be something like "How