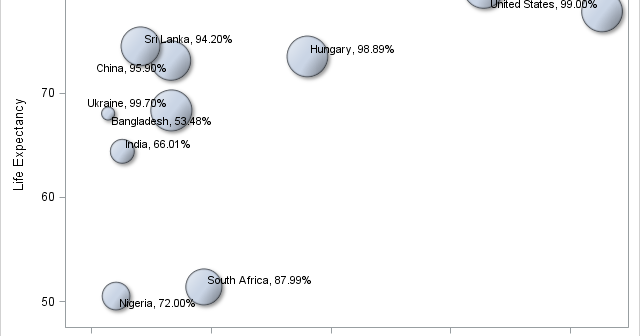
Proportionally sized bubble plots
Bubble plots are often used to display social and economic data as Gapminder effectively does. With the addition of the BUBBLEPLOT statement to SAS 9.3, it is now possible to create bubble plots in SAS with a few lines of code: proc template; define statgraph bplot; begingraph; entrytitle 'Bubble Plot


