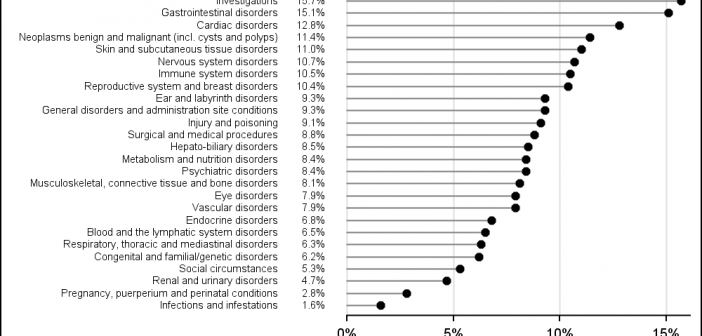
CTSPedia is a valuable resource for clinical research "... initiated to form an information resource created by researchers for researchers in clinical and translational science to share valuable knowledge amongst local researchers". This site includes a section on statistical graphs where you can find valuable information and a library of standardized
Tag: Dot Plot
CTSPedia Graphs - Dot Plot of Primary SOC
Forest Plot with Subgroups
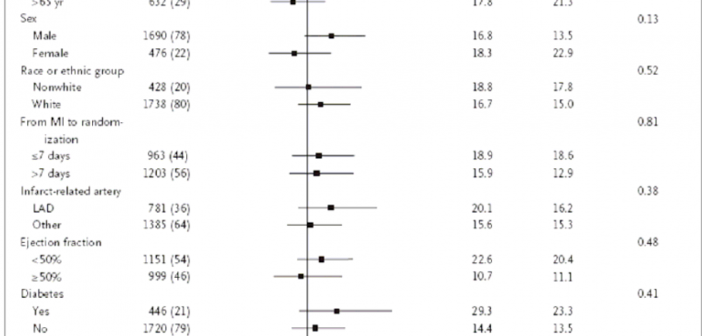
During SAS Global Forum 2012, I had conversations with many SAS users who wanted to create Forest Plots. However, there was one new twist. The study names were subgrouped by categories like 'Age', 'Sex', etc., with multiple entries under each subgroup. The name of each study within the subgrouped was indented
Graphs with log axis
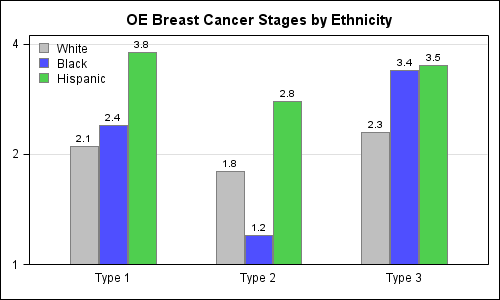
Recently I posted an article on this blog on how to create bar charts with log response axes in response to a question by a user. This generated some feedback suggesting that bar charts should not be used with log response axes or with a baseline of anything other than