Search Results: forest plot (33)

Data Visualization
Sanjay Matange 4
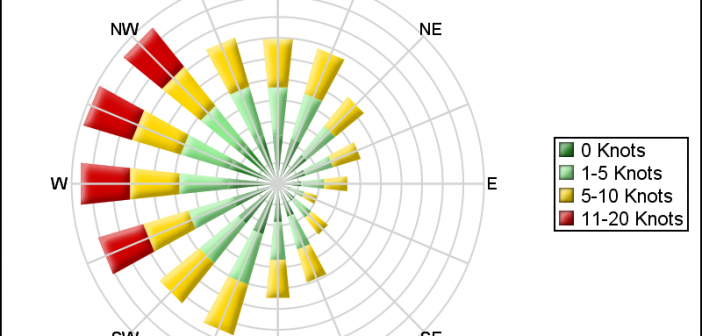
Polar Graph - Wind Rose

Last week I posted an article on displaying polar graph using SAS.  When the measured data (R, Theta) are in the polar coordinates as radius and angle, then this data can be easily transformed into the XY space using the simple transform shown below.     x=r*cos(theta * PI / 180);     y=r*sin(theta * PI

Data Visualization
Sanjay Matange 0
Report from SGF 2015

SGF 2015 was a blast with a focus on Visual Analytics, SAS Studio, Hadoop and more.  Graphs were everywhere, and it was a banner year for ODS Graphics with over 15 papers and presentations by users on creating graphs using SG Procedures, GTL and Designer. Dan Heath, Prashant Hebbar, Scott

Data Visualization
Sanjay Matange 4
Report from WUSS 2012

A week ago, SAS "wusses" got together in Long Beach, California for another successful WUSS conference.  Personally, I really enjoy all SAS user conferences as it gives me an opportunity to see the creative ways in which SAS users are exploiting our software. One such case was the paper "Power