Get the right information, with visual impact, to the people who need it
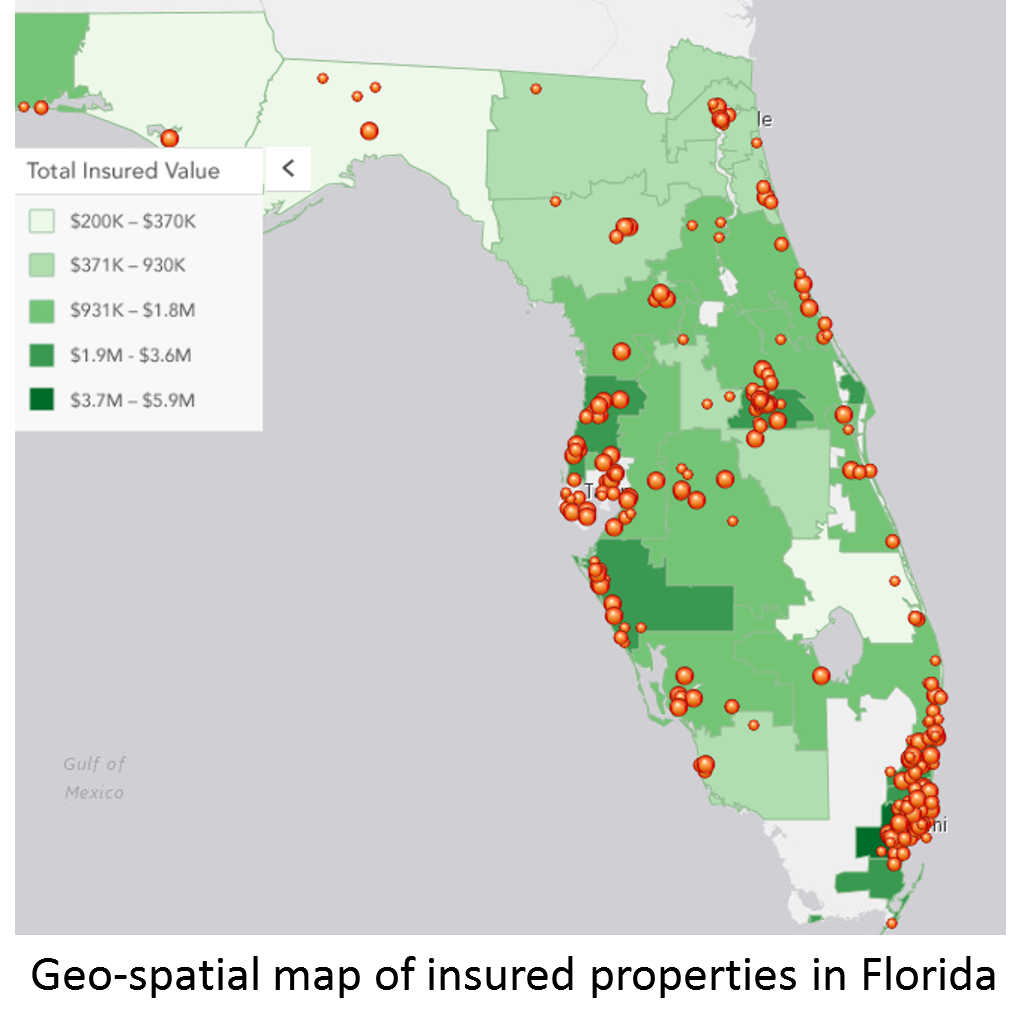
Location, Location, Location

If you buying or selling a house. The relator will tell the value of the property is all about location, location, location. For insurance companies location is just as important. For an underwriter assessing the risk on a property is essential that they consider the location of the property. How