Get the right information, with visual impact, to the people who need it
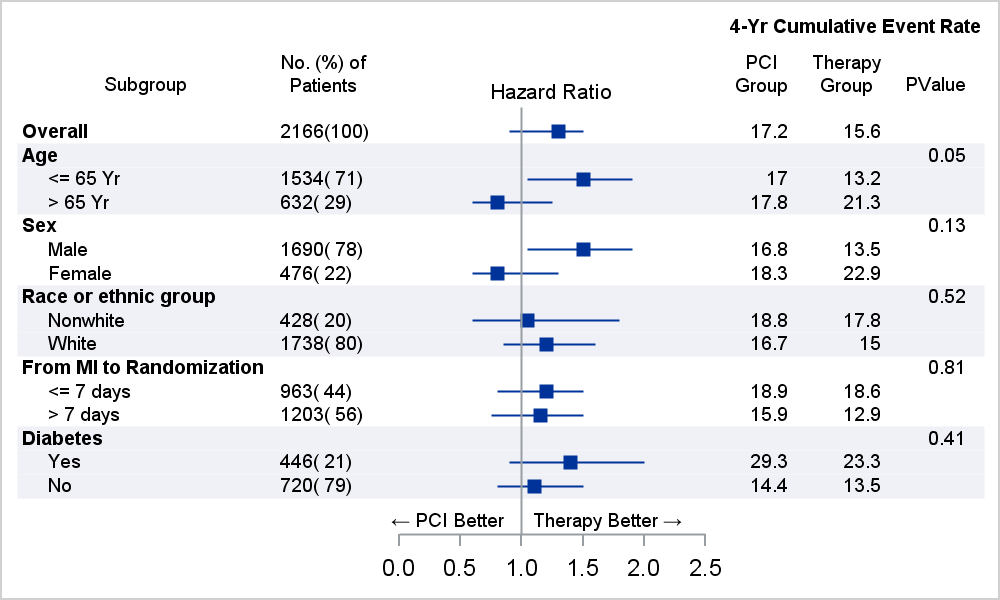
CTSPedia Clinical Graphs - Subgrouped Forest Plot

The advent of the AXISTABLE statement with SAS 9.4, has made it considerably easier to create graphs that include statistics aligned with x-axis values (Survival Plot) or with the y-axis (Forest Plot). This statement was specifically designed to address such needs, and includes the options needed to control the text attributes of