Get the right information, with visual impact, to the people who need it
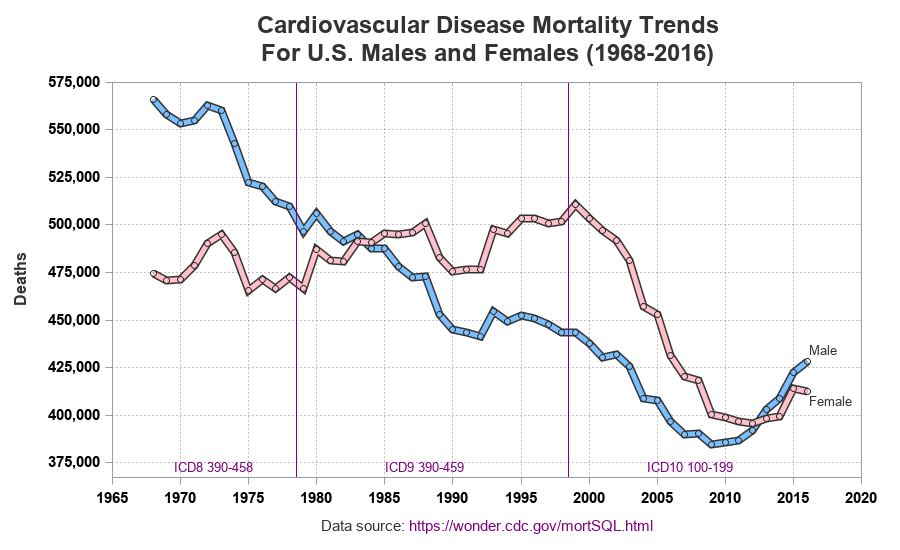
Graphing cardiovascular disease mortality data

I have written several blog posts about longevity, and here is another one related to that topic. Cardiovascular disease (cvd) is one of the more common causes of death, and I was wondering how those numbers have changed over time. Are fewer people dying from cvd, or are more people