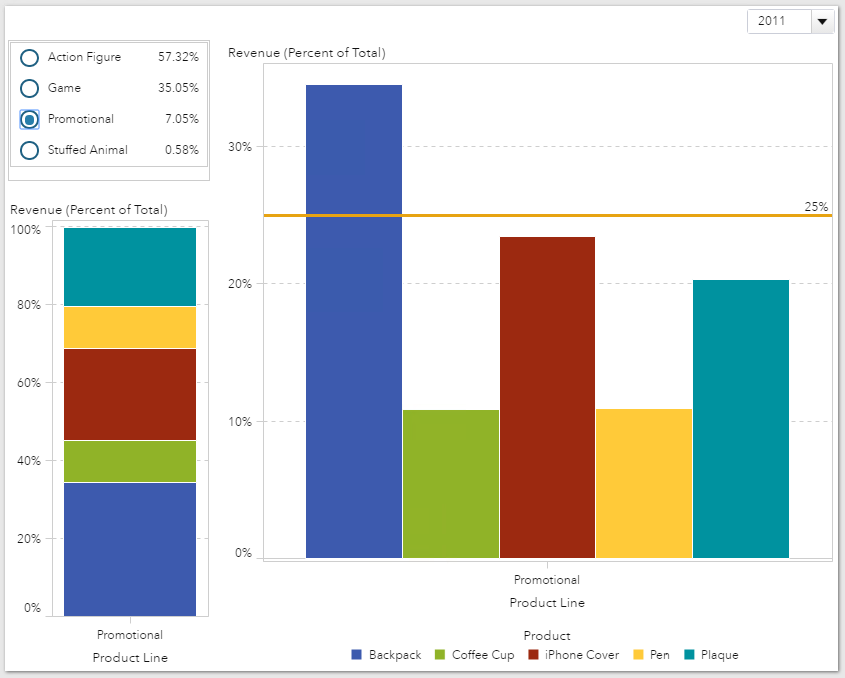
Use Percent of Total and Reference Lines to ask better business questions

Reference lines on a visualization are used to help identify goals or targets, acceptable or unacceptable ranges, etc; basically any metric that puts a frame of reference around the values on the visualization. The Percent of Total of a metric is used to help identify a part-to-whole relationship. It answers