A parametric bar chart in SG Procedure and GTL parlance is a simplified version of the regular bar chart, where the data is assumed to be summarized prior to its usage inside the SG procedures or GTL. So, multiple occurrences of the same category and / or group combination is
Tag: SGPLOT
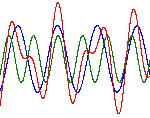
Parametric Bar Charts
Mathematical squiggles in SAS
John D. Cook shared a picture of "pretty squiggles" on his blog, as well as a prose description of the mathematics behind it. I'm more of a programmer than a mathematician, but I've attempted to transcribe his description into a SAS program. I used DATA step to generate the point
PharmaSUG 2012 update
PharmaSUG 2012 conference drew to a close today, concluding two and a half days packed with papers, presentations, posters, hands-on demos and super demos by SAS staff. While the weather outside was a bit chilly from time to time, the conference what hopping with many user papers on how to