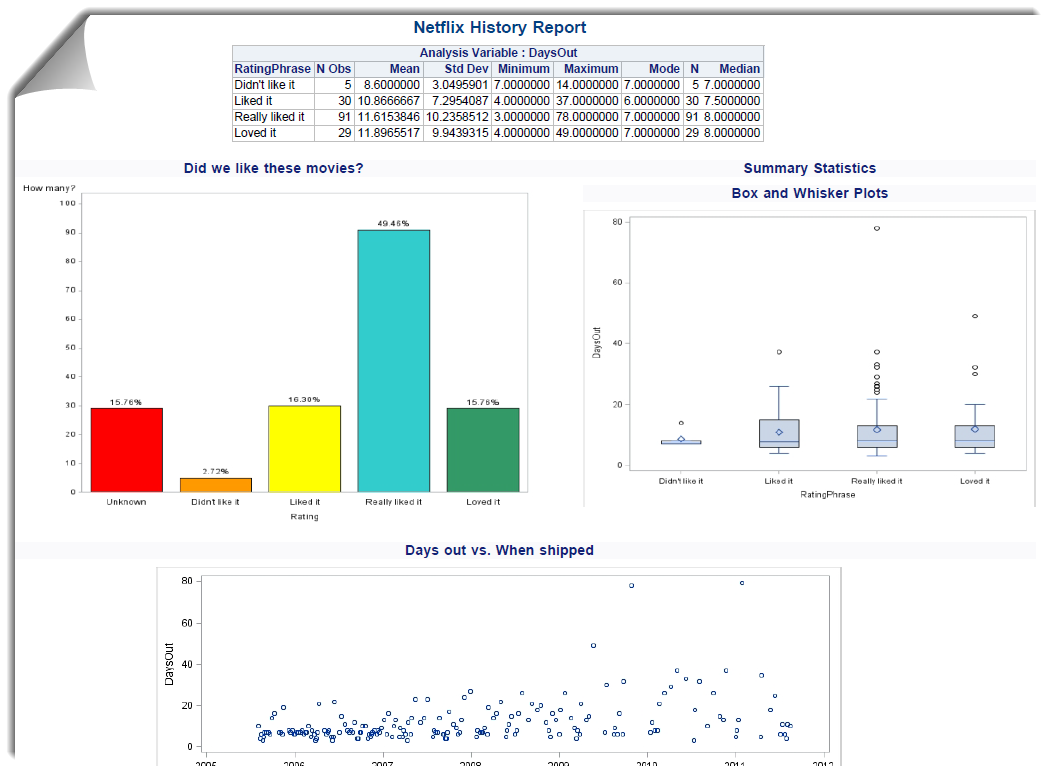
Do you want your report to look good on the web, or to look good when you print it? Pick one. Before the SAS Report file format, that was the choice that you faced. HTML is perfect for the web browser. It's easy to scroll through tables, to apply an

Do you want your report to look good on the web, or to look good when you print it? Pick one. Before the SAS Report file format, that was the choice that you faced. HTML is perfect for the web browser. It's easy to scroll through tables, to apply an

Useful charts can serve to persuade an audience of certain "truths", because they take real data and communicate it in a clear, visual medium. But what happens when you know something to be true, but you have no real data? Should you let the lack of hard data prevent you

Let's say you use SAS Report format, the latest tagset supported by ODS. After all, it's the lingua franca of SAS BI applications, since it's also used by SAS Web Report Studio, SAS Add-In for Microsoft Office, and SAS Enterprise Guide. You've discovered how to use the report builder in