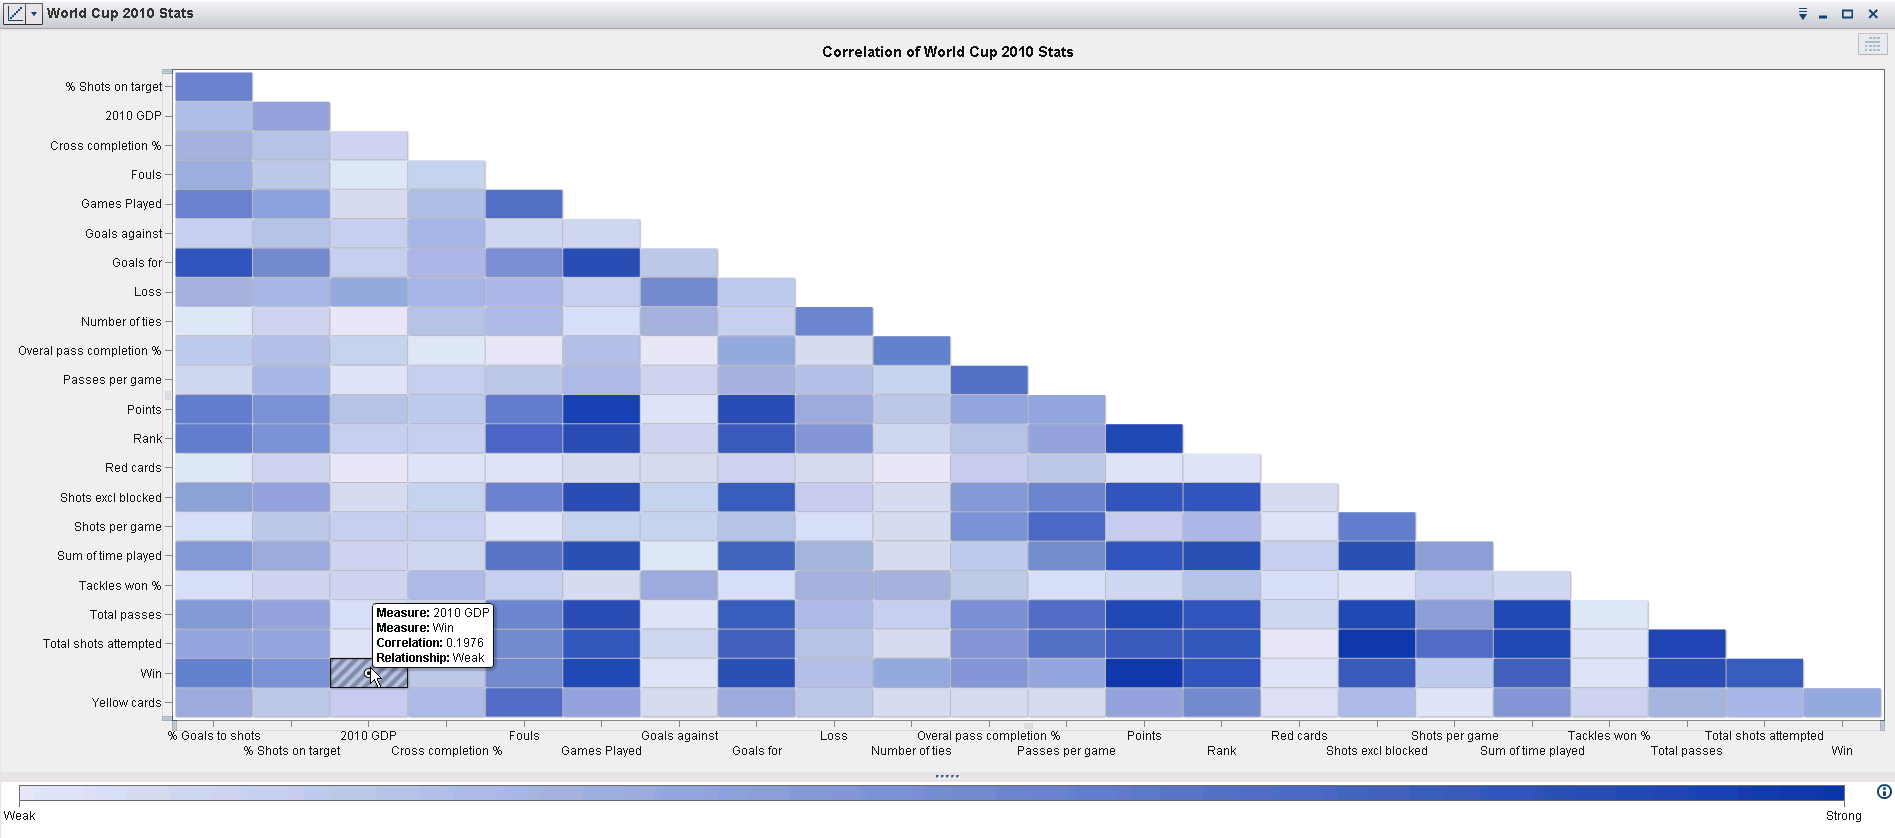
Recently, I was reading an online article about predictive modeling and "big data." Its premise was to determine whether the use of big data actually led to more accurate and meaningful predictive models and forecasts. After citing numerous external examples and internal tests that the authors had compiled, it stated
Tag: data visualization
Is big data really better?
Path analysis with SAS Visual Analytics
Introduction Understanding the behavior of your customers is key to improving and maintaining revenue streams. It is a an important part when crafting successful marketing campaigns. With SAS Visual Analytics 7.1 you can analyze, explore and visualize user behavior, click paths and other event-based scenarios. Monitoring the customer journey by visualizing
What is the most valued position in football?
After the 2014 FIFA World Cup, one thing’s clear: here at SAS, we love football (soccer in the US!). To wrap up the popular 2014 World Cup data visualization series on the SAS Visual Analytics Community, we created a presentation that’s chocked-full of interesting insights. From the trillions of pieces