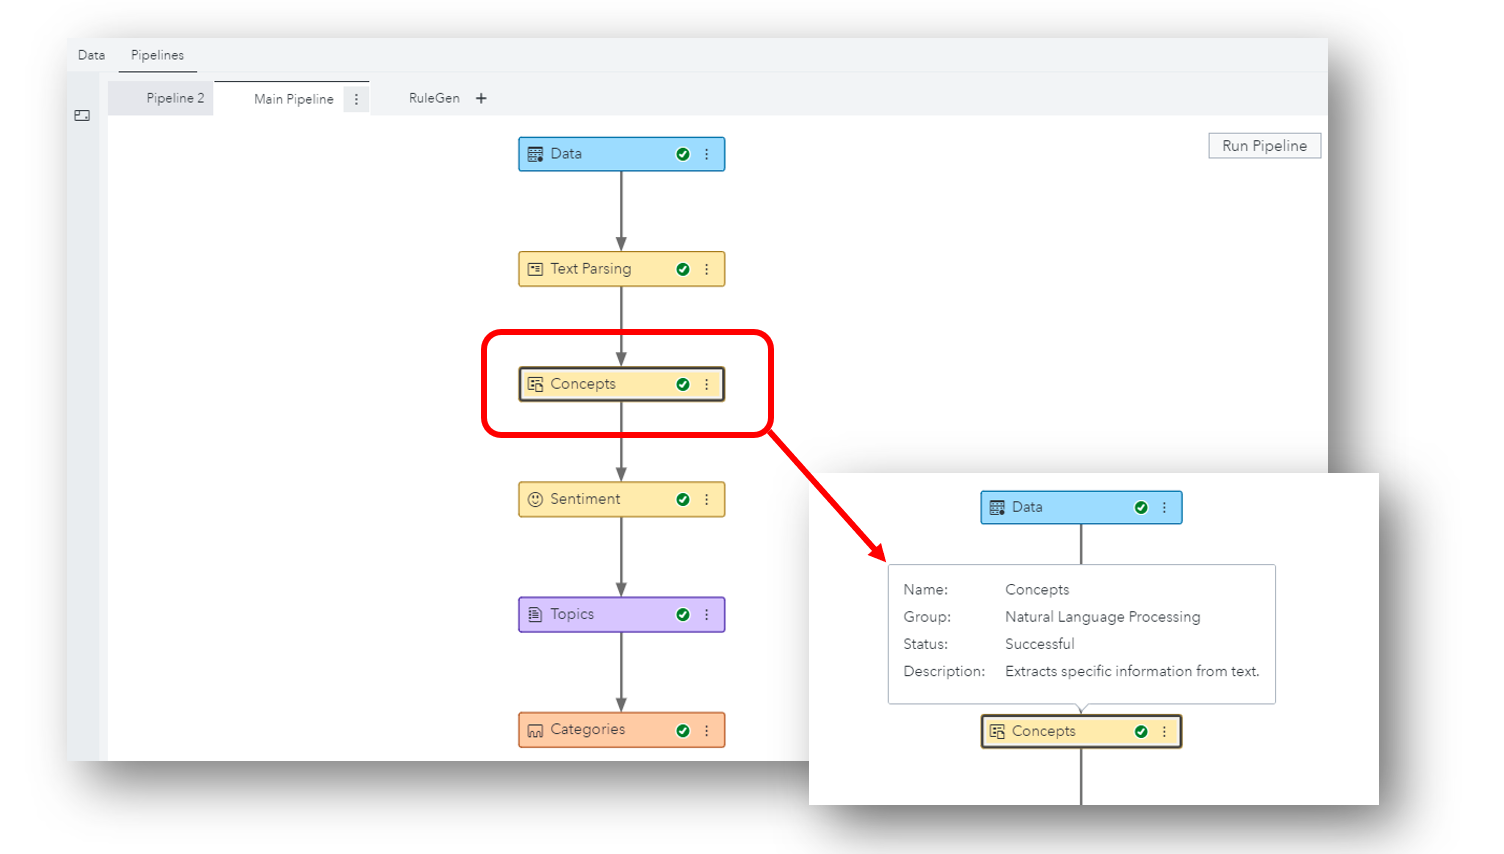
There is tremendous value buried text sources such as call center and chat dialogues, survey comments, product reviews, technical notes, legal contracts... How can we extract the signal we want amidst all the noise?
In this post, we continue our discussion of geography variables, the foundation of Visual Analytics Geo maps. This time we will look at Custom Coordinates. As with any statistical graph, understanding your data is key. But when using Custom Coordinates for geographic maps, this understanding becomes even more important. Use
Beginning with SAS® 9.4, you can embed graphics output within HTML output using the ODS HTML5 destination. This technique works with SAS/GRAPH® procedures (such as GPLOT and GCHART), SG procedures (such as SGPLOT and SGRENDER), and when you create graphics output with ODS Graphics enabled. Most (if not all) existing