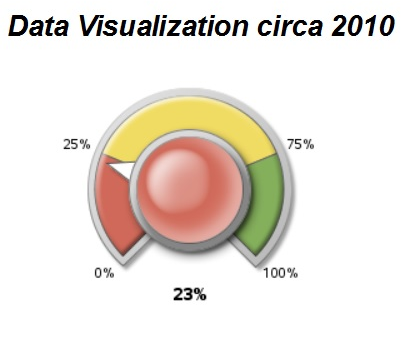
Data visualization before and after

A colleague and I were looking for a good example of how analysts used to use graphics to report data, a data visualization before and after, so to speak. We needed a good "before" screenshot for a “before and after” comparison for our SAS Global Forum 2015 paper, Visualizing Clinical Trial Data.