Authors of A DevOps journey at SAS: Billy Dickerson and Connie Dunbar
SAS is powering disruption in the analytics space by leveraging the benefits of our DevOps journey. This continuous analytics journey, to deliver software to our customers faster and more frequently, began several years ago. It enables us to be the analytic software provider of choice. This journey was challenging in many ways. We needed to evaluate and transform numerous SAS-wide processes that had been in place for years. We had to look across our many lines of business and pivot to adopt a completely new way of doing things. And we still had to focus on maintaining the high quality of software that our customers have come to expect.
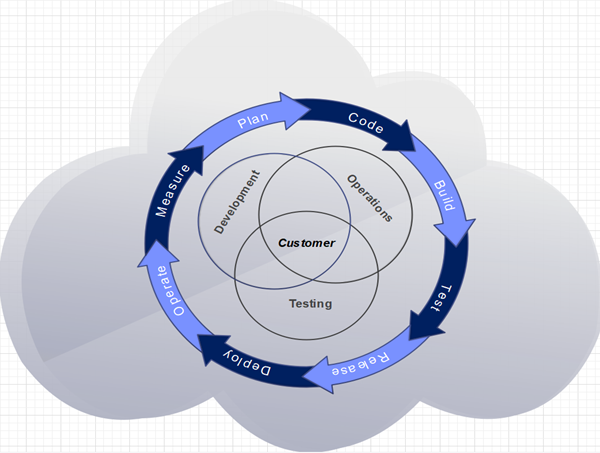
To respond to this challenge, we began leveraging industry-proven practices, such as DevOps, Continuous Integration, and Continuous Delivery (CI/CD). Figure 1 shows our continuous DevOps journey at SAS. It’s our commitment to delivering quality software more quickly to our customers that lies at the heart of it all.
What are DevOps and CI/CD?
DevOps is short for development and operations. It's a collaborative practice to break down the barriers between development and operations teams. Teams adopt the DevOps culture and practices to increase confidence in the software they produce, respond better to customer needs, and achieve business goals faster.
Continuous Integration (CI) and Continuous Delivery (CD) are a subset of the DevOps umbrella. They enable software engineering teams to deliver code changes more frequently and reliably. This is achieved by enforcing automation in the building, testing, and deployment of the software. The CI/CD workflow is aimed at providing rapid feedback on any impactful issues that might affect the delivery of the software to market.
A DevOps journey story: “Continuous Analytics” and “Below the Line”
Like many research and development teams at SAS, the Analytics R&D teams had many challenges on their DevOps and continuous journey. We had to deliver more frequent code changes faster while continuing to maintain quality for our internal and external customers. This post describes several of those initial challenges and the strategies our Analytics DevOps team employed to design minimal-impact solutions with the goal of having Quality at Speed.
Challenge 1: “The Daily”
Before we started on our DevOps journey, we traditionally waited for code changes to be built and delivered once a day. We had an internal code-named “The Daily” for this process. The Daily was an R&D-wide SAS deployment that contained the latest development code changes and bug fixes. It was made available for consumption and testing once every 24 hours. Members of the testing community waited for The Daily to perform testing of new code changes and for developing new tests. If a test engineer found an issue during the testing and verification process, the test engineer opened a defect. Then the developer fixed the issue, and the code change could take up to two days to become available. We needed to have the ability for new code changes to be committed, built, deployed, and tested continuously multiple times a day.
Challenge 2: internal customers
Another challenge we faced was that the code base was used by other internal development teams. So, it needed to be stable to avoid negatively impacting those teams by causing unplanned work. Also, those other development teams needed to consume our code base to make progress on their sprint stories, which drove the need to get them the code as soon as possible in a more reliable manner.
Challenge 3: “Above the Line” and time to production
The need to deliver software to our customers faster and more frequently required us to invest in a new software continuous delivery pipeline. This pipeline consisted of several stages and was modeled around automation and quality. The internal code name for this next-generation pipeline was “Above the Line."
In the Above the Line pipeline, for new code to get automatically promoted from one stage to the next, automated verification tests are triggered and required to pass successfully. If the tests do not pass successfully, the code is not allowed to move to the next stage. This delays the code from reaching production and being delivered to our external customers. Also, finding a problem with our software in the later stages of the Above the Line pipeline was costly as it had a longer feedback loop. There needed to be a complementary process in place to enable testing to occur much earlier in the software development lifecycle to enable the Above the Line pipeline to be more stable and enable code changes to automatically flow to production faster with higher quality.
Solution: welcome “Continuous Analytics” and “Below the Line”
After our Analytics DevOps team evaluated the challenges, we collaborated with members of the Analytics R&D teams and the Above the Line engineering teams. We concluded that shifting more quality earlier in the development cycle, combined with the additional DevOps principles of continuous integration, delivery, deployment, testing, monitoring, and feedback would be beneficial to solving these challenges. We code-named this project “Continuous Analytics”. Our new complementary research and development pipeline was called “Below the Line."
Shifting left to Below the Line: benefits
In the Ultimate Guide to Shift-left-testing from DZone, shift left testing is described as “an effort to bring testing earlier into the development lifecycle while improving quality measures...”. (For more details, visit DZone.)
While considering the following shift left benefits, the Analytics DevOps team believed incorporating this strategy would help solve the above challenges faced by the Analytics development and test teams:
- Finds software issues earlier
- Shorter feedback loop
- Reduces maintenance costs for both development and testing teams
- Enables teams to fail fast and fix fast
- Less impact on others
- Enhanced stability at later stages of the software continuous delivery pipeline – Above the Line
- Affords faster time to market
- Supports customer quality satisfaction
- Contributes to competitive advantage
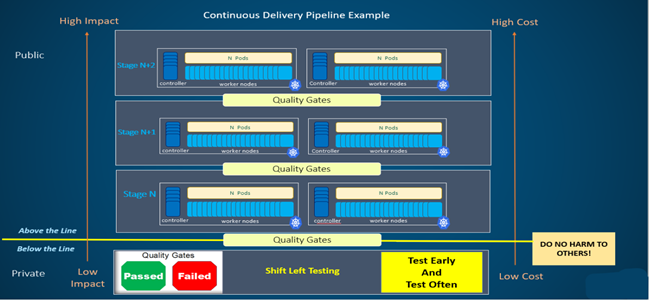
Figure 2 is an example of a continuous delivery pipeline. It shows how shift left testing would fit into the workflow and also highlights the benefits of this type of testing:
Implementation
The product suite being developed in Analytics Research and Development consists of approximately 50 microservices across a three-tier full-stack architecture (client, middle, and server) where the development and testing are taking place across several different engineering teams across the globe. This meant that another design requirement would be that the implementation would need to be functional around the clock – 24/7.
The initial step for the Analytics DevOps team was to collaborate with many different teams to onboard the various deliverables into the Below the Line process. Each team was able to share their requirements and test suites to onboard into the automated workflow.
Also, through collaboration, another common set of goals that ended up being part of the implementation is the following:
- Onboard as many integration tests as possible.
- Never simulate the SAS deployments.
- Use SAS deployments that a customer could order.
- Measure and analyze our Below the Line processes using SAS products to assist in making continuous improvements in our automated pipeline.
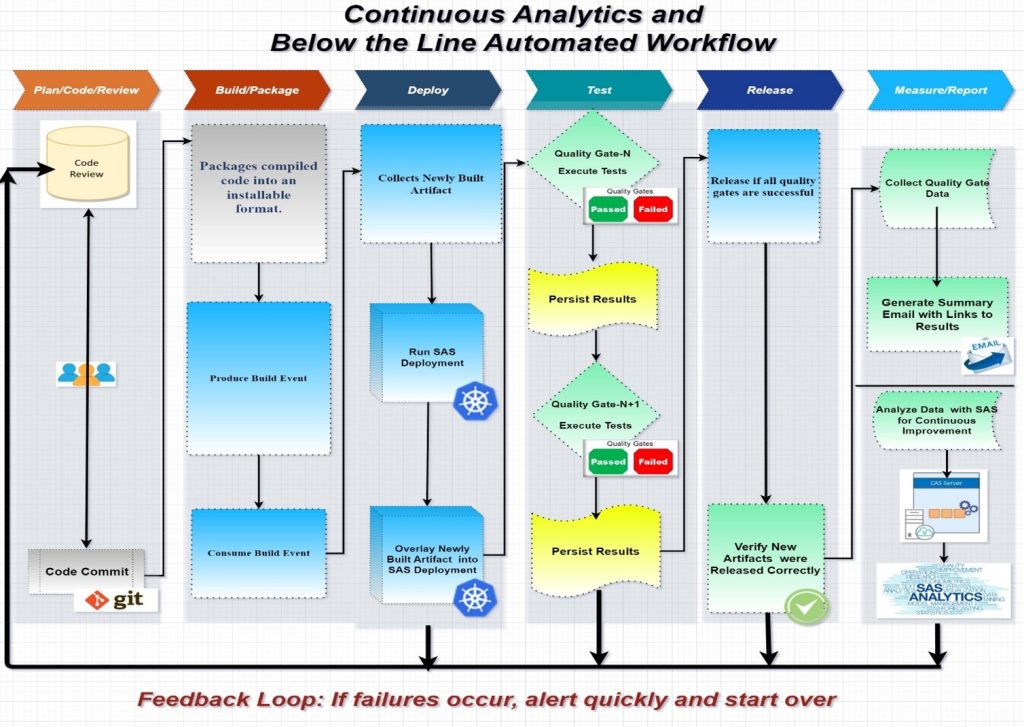
Figure 3 shows a high-level visual of the Continuous Analytics implementation, automated workflow, and feedback loop:
Metrics, measuring, and the continuous feedback loop
Another goal was to continuously collect, measure, and analyze our Below the Line CI/CD processes. We wanted to focus on the measure slice of the CI/CD feedback loop and use the data to make informed decisions to continuously improve and shorten the feedback loop.
We decided to use our own SAS products because data and analytics are the core of SAS’ DNA. A benefit of using our very own software as our customers would is that we can open requests to our development and test teams for enhancements and bug fixes and thus take pride in our products. Learn more by reading Drinking our own champagne: CI/CD process improvements using analytics.
Our challenge was deciding what category of metrics to collect that would shorten the feedback loop. Our initial charter settled on the following standard DevOps metrics, with plans to expand as we move toward future stages:
- Change Volume and Velocity
- Quality and Health
- Performance and Stability
- Cost
- Auditing
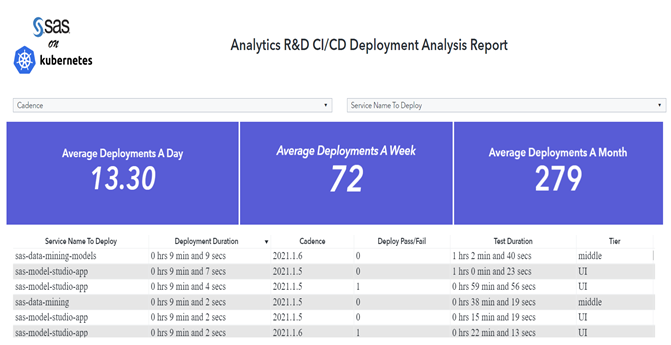
An initial example report is shown in Figure 4. It tracks the number of SAS deployments that have developer fixes being verified through established quality gates
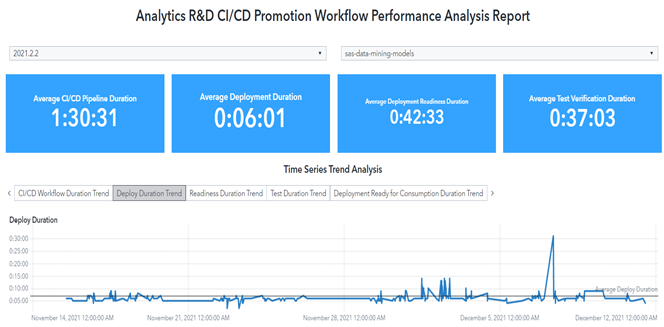
Another example report, shown in Figure 5, tracks the overall duration of sample stages of the Below the Line CI/CD workflow.
Continuous learning and improvement summary
We hope you have enjoyed learning about how we are powering disruption in the analytics space by leveraging the benefits of our DevOps journey. Delivering software to our customers faster and more frequently is just one aspect of SAS’ transformation. These efforts are part of a continuous journey and not a destination. Stay tuned for future posts including continuous monitoring and logging, continuous performance, continuous security, continuous quality metrics, continuous everything…
Connie Dunbar leads a SAS team of highly skilled individuals responsible for DevOps, developing and testing cloud-enabled SAS analytics common microservices, designing and guiding the implementation of secure software development life cycle, producing internal and external analytics communications, and delivering continuous quality metrics. She is passionate about DevOps, CI/CD, quality, automation and proudly holds a test automation patent. She enjoys horizontally enabling continuous improvements throughout the SAS analytics division, leveraging innovative and transformative approaches.


