 In SAS Viya 4, we can embed inputs directly on the reporting page with live results. These reports have code that takes user inputs and runs the program, which will run the dataset and update it with the most recent data. This gives the user the ability to create datasets on the fly and share the results with their teams.
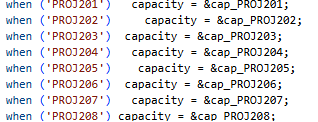
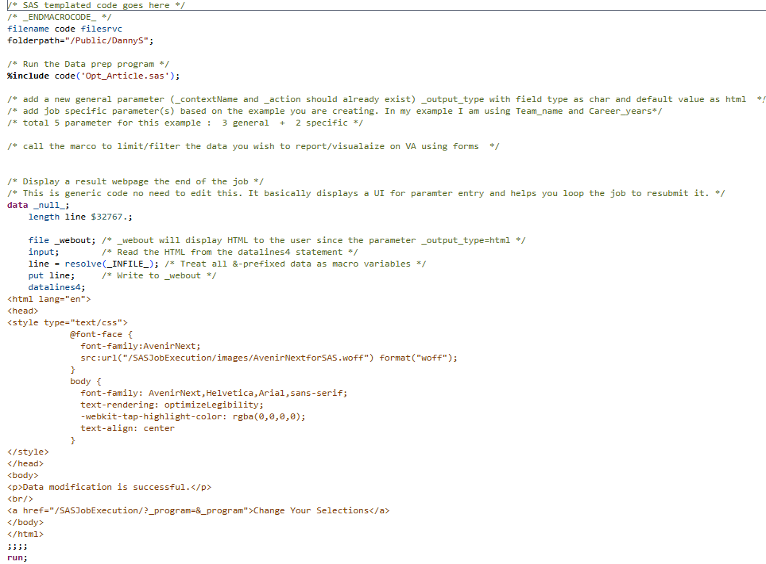
We begin with our code, which creates macros that can communicate with our report and eventually the job that runs in the background of the report. Below (Figure 1), we can see the variables being brought into the code. They are then assigned values that will be used in our code and formulas (in my example, I have an optimization running in SAS code called Opt_Article.sas, which is where the macros are referenced). The code can then run in whichever program the user would like, but at the end of the program, there must be an upload process to get the final table into the CAS engine. Our table is named Project_Opt. This table will come into play later. For this example I am assigning values to project capacity, which could be used as budgets and time constraints.
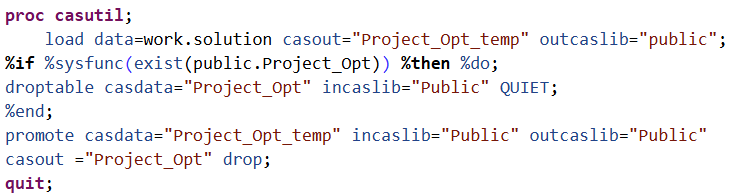
For this code to update a report live, the code must finish with an upload statement that takes down the previous dataset and replaces it with the updated dataset with the same name (Figure 2).
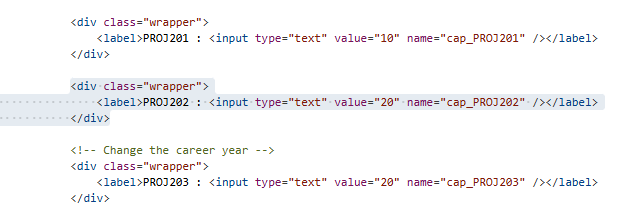
The next step is to create a job in SAS. The user must create a new Job Definition and change the form to HTML. In the code, the user will need to create HTML code that reflects the inputs required by the macros. In Figure 3, the HTML for the inputs are shown. These allow the user to provide a base value and title for the input.
Then, the program side of the job must reference the code the user created that contains the formulas that utilize the macros (Figure 4).
On the right-hand side of the job interface, the parameters must be selected (Figure 5). This is where the macros need to be reflected for the report, matching the ones entered in the code and HTML. The additional parameters are for debugging purposes.
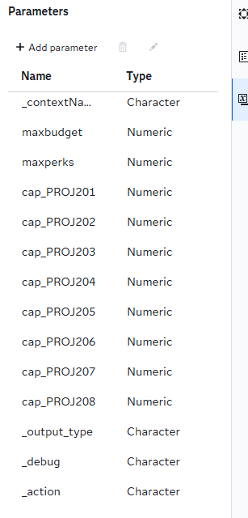
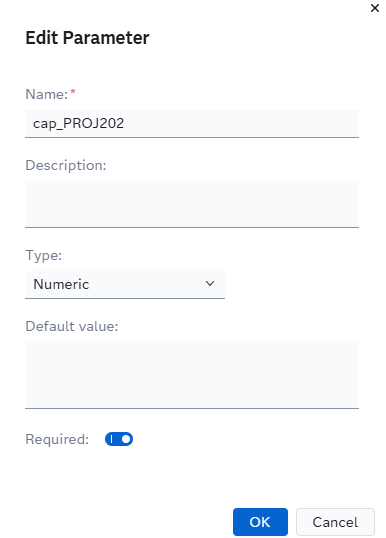
Figure 5: Input Parameters (left) and setting up the parameters (right)
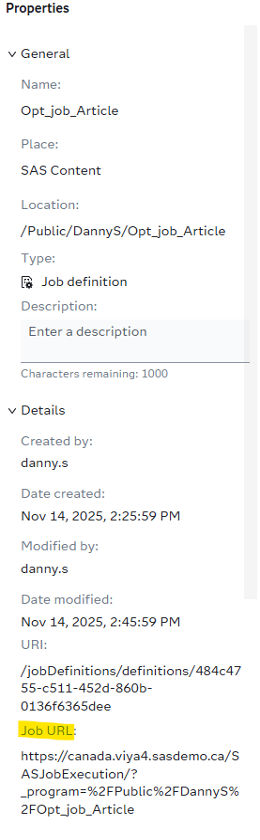
Once this is completed, the job is ready for use. Copy the URL provided in the properties tab under Job URL (Figure 6).
Then, in a VA report, select the Web Content object. In the options tab of the object, place the URL. The job interface should appear. The user must then bring in the table that is created from the program, Project_Opt (Figure 7).
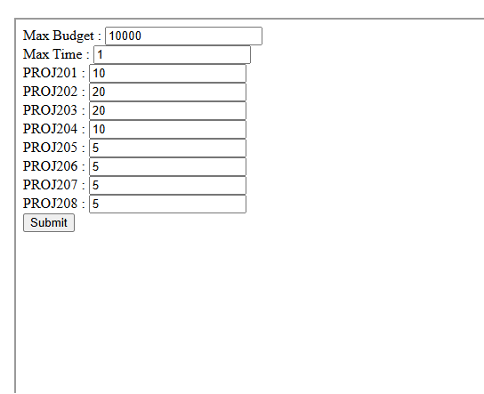
The data can now be shown in graphical interfaces. In the options tab for any graph using the table, select Periodically Reload Data and set a short timeframe. Then switch to non-edit mode and run the job (Figure 8).
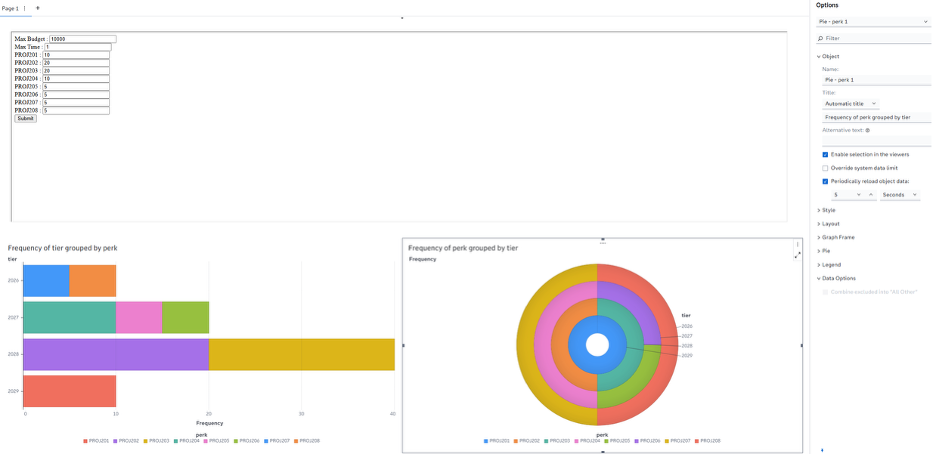
The report should update as you run the submission, providing the updated dataset and report. This allows the user to share project results live with their teammates and gives non-coders the ability to manipulate the datasets to generate value for their workforce.