Editor's note: Amanda Farnsworth is Head of Visual Journalism at BBC News and a featured speaker at SAS Global Forum 2017, April 2-5, 2017 in Orlando.
My days are spent trying to put the best content we can in front of our loyal, heartland audience, while reaching out to others, particularly on social media, who may never usually come to the BBC for their news.
It can sometimes be hard to reach both audiences at the same time.
But recently we hit on a format that does exactly that. We call it The Personal Relevance Calculator. We have made a whole series of these calculators on different topics, including “The Great British Class Calculator” (yes we Brits are still obsessed with Class!) and “Will a Robot Take Your Job.”
The idea is to take a big data set that tells a story and make it personally relevant to each and every user. Readers simply enter a small amount of personal information – it could be their age or height and weight, or a postcode of where they live – and the result they get back from the calculator is unique, or appears to be unique, to them. This result is given in a rich, visual way and is very shareable on social media.
The advantages are a much deeper engagement in the subject than we might get by writing a traditional article and they are usually very popular, getting millions of hits, likes and shares. They also appeal to the parts of the audience other BBC content doesn’t reach.
Case Study - Who Is Your Olympic Body Match?
You can find the Olympic Body Match calculator using this link:
At the BBC, we know that the Olympics provide us an opportunity to reach a part of the audience that doesn’t often think of us. Let’s call them Main Eventers – they are people who don’t like to be left out of those water cooler conversations when a big national or international sporting event is going on. So they want some way of engaging with a story that they often don’t know much about. Perhaps they are not big sports fans.
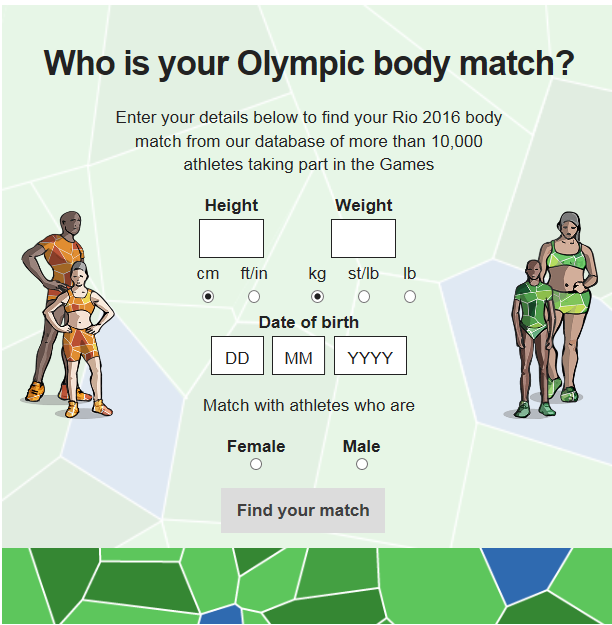
Enter our calculator. By putting in your height, weight, date of birth and sex, our calculator matches you with the Olympic athlete most like you. Simple but very engaging!
We took care to make the calculator a rich, visual experience with beautiful illustrations drawn by one of our designers. We also used the colourful, carnival branding that our Marketing department came up with and which was used across all BBC Rio 2016 output during the Olympic and Paralympic Games. This didn’t look like a scary sports story, but more of a fun way to be part of the buzz that surrounds the Olympics.
The Calculator Results in Detail
After putting in the four pieces of personal information, the first result showed you how your height compares with the full range of Olympic athletes in Rio.
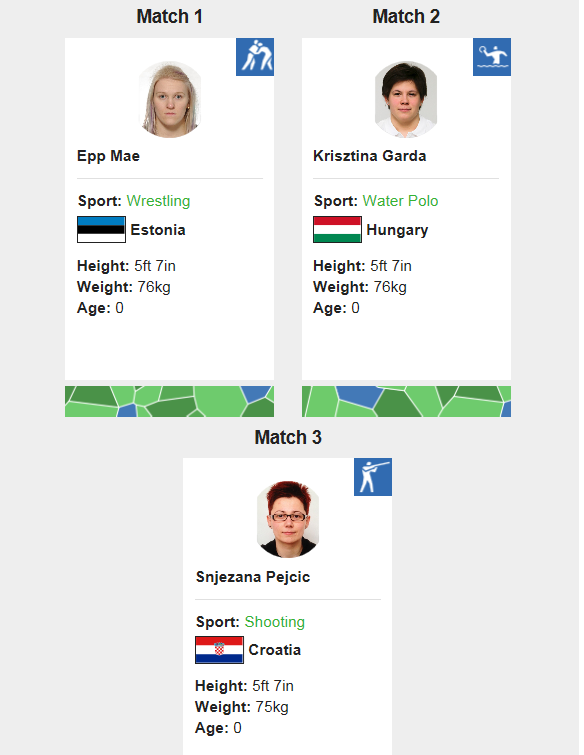
The next page did the same with your weight, the third with your age. And finally you were shown the 3 athletes most like you.
You may have guessed that these are images of my own Olympic Body Match – I’m not sure being most like an Estonian Wrestler is quite what I had expected!
Hitting the share button generated a box pre-populated with text that enticed the users who received the results to have a go themselves. A link to the calculator is also embedded in the tweet, along with another attractive illustration.
The data and what we did with it.
The data for this interactive was from the Olympic Data Feed, which is used by the BBC and other broadcasters to show the results of all the different events. As part of this feed, the height, weight and age of over 10,000 athletes was available for my team to repurpose.
So far, so good. But it turned out not all the data was available ahead of time. A lot of the information was collected in the days running up to the Games, as the athletes started arriving in Rio, making things a little tight for our development deadlines. To solve this problem we made some test content using figures from the 2012 London Olympics, which we swapped out later for the Rio figures. (The figures for the British track and field team, of particular interest to us, arrived just as the Games were starting.)
As the real data started to come in, we kept our eyes peeled to see who would be the tallest, shortest, heaviest and lightest athletes, as we wanted to highlight them in our graphics, to show the interesting and extreme range of body types represented at the Games.
But, here we had to be careful. As with any dataset this large there was bound to be the occasional glitch, especially when you’re looking for the outliers. Initially the dataset looked as if it contained a rower weighing improbable 200 kilos, and a swimmer whose height was well over seven feet tall.
By checking back with the source, we were able to work out which outliers were incorrect, and which outliers were the right ones for us to focus on.
The shortest athlete was Brazilian gymnast Flavia Saraiva (4ft 4in); the tallest was Li Muhao a Chinese basketball player (7ft 2in).
The data was provided to us through XML feeds. We matched our readers with the athletes using Euclidean distance. Where someone’s height and weight created more than three matches we picked the athletes whose own birthdate was closest to our reader’s as a way to break ties.
Audience Reaction
Our Body Match Calculator had 4m browsers, 5.8m page impressions and an engagement time of just over a minute.
The audience was 37% female and 63% male – using the gender people matched with as a proxy.
There was good engagement going down the page, with 66% of browsers filling in the form and getting to their results at the foot of the page.
It also did really well on social with this thread on reddit generating nearly a 1,000 comments.


