As an addendum to my previous two blogs on using the SAS Environment Manager Report Center, this blog illustrates further tips and tricks you can use to help make the creation of your custom reports easier.
The Ad-Hoc Reporting section of the Report Center is specifically designed to provide a “testing ground” for reports you may want to try. займ на карту. It can be your most useful tool in designing and creating the reports you want. Notice that the first four “reports” are most useful if you have a good idea of what content you want your report to have; they present specific report content, and it’s easy to see what type of data these reports would contain, just based on the titles or names shown.
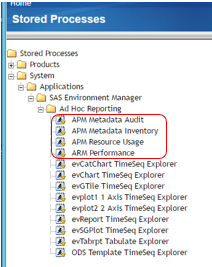
Selecting any of these four reports will generate a list of all possible reports in that category. From here, you can select the one(s) you want. Here are a few screenshots to illustrate:
APM Metadata Audit: If you make this selection in the Ad Hoc Reporting section, you will be presented with a choice of all reports in that category, under the Report Name field dropdown list in the right-hand panel. Notice that most of these report selections correspond to finished reports already created in the main report section, marked on the left below. If you just run this Ad Hoc report with all the defaults, you’ll get the same report as the one listed in the Nightly Reports >> Audit Reports section. However, you can test some additional parameters using the Ad Hoc version’s menu shown.
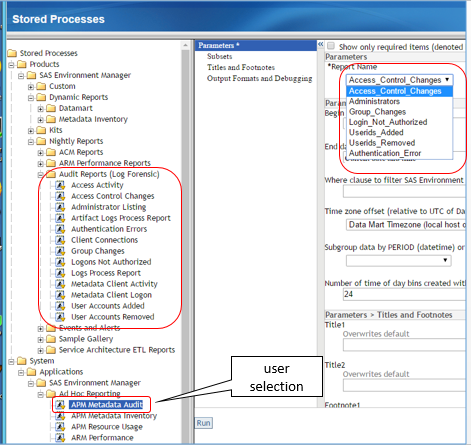
You will find similar choices for all four report groups in that section of the Ad Hoc Reporting. Thus, you have a way to tinker with many of the other standard reports, and try various modifications to them. For example, if you are interested in any of the “ARM Performance Reports,” you can open the ARM Performance section in the Ad Hoc Reporting section to get a set of reports that (mostly) mirror those reports: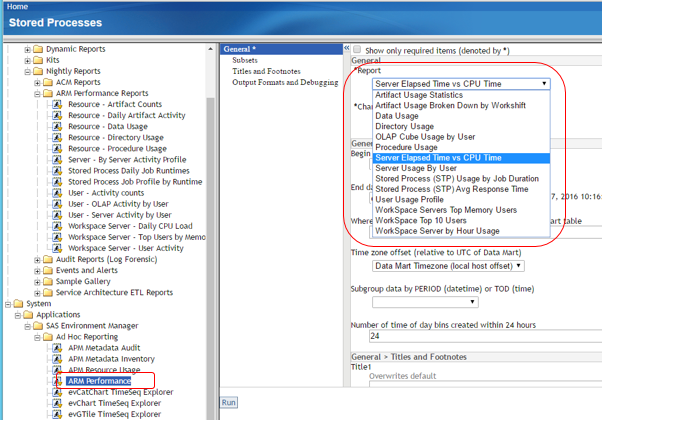
This allows you to explore different parameter options beyond what’s provided by the standard reports, such as chart type, number of time bins, and subgrouping time periods.
A different approach is to explore your data using any of the remaining Ad Hoc reports that are organized around the type of output plot you want. As discussed in the previous blog, the name of the Ad Hoc report shows the type of plot generated based on the SAS PROC name. These reports allow you to select a dataset to explore from any of the following three built-in DataMart libraries: ACM, ARTIFACT, or KITS. The Ad Hoc reports that can be used in this way are circled below:
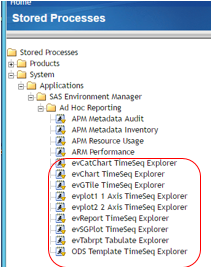
For example, if I want a basic chart, and I want to use the dataset ARTIFACT.AUDITACCESSC, then I can select the Ad Hoc report called “evChart TimeSeq Explorer,” choose my data set from the dropdown list, and then try varying any parameters provided in the interface to explore and come up with many variations and charts based on those two choices. Notice that with this group of Ad Hoc reports, there are more parameter choices than with other reports:
You can select many reporting options, such as multiple variables, type of chart, class variables, break variables, subgroupings, statistics, as well as the more standard subsetting and output format options. You can generate literally hundreds of different reports using varying parameter selections using these Ad Hoc Reports.
As I mentioned in a previous blog in this series, if you want to create a custom report for production that you will run many times, you will want to make a permanent, new copy of the stored process being called, with the correct parameters specified on the reporting macro being called. I outlined the steps to do this in the previous blog: Creating Custom Reports in the Report Center.
The way to do this is to model your report on an existing report, then make modifications to it. You will want to know the following about the report you are using as a model:
- What stored process is being used?
- What reporting macro(s) are being called?
- What parameters are being specified to the reporting macro?
- What data set from the Data Mart is being used?
The best way to answer these questions is by using the debugging facility that is built into the report center. All reports provide the following debugging options:
- Debug Level
- Session Information: Log
- Macro Invocation Parameters
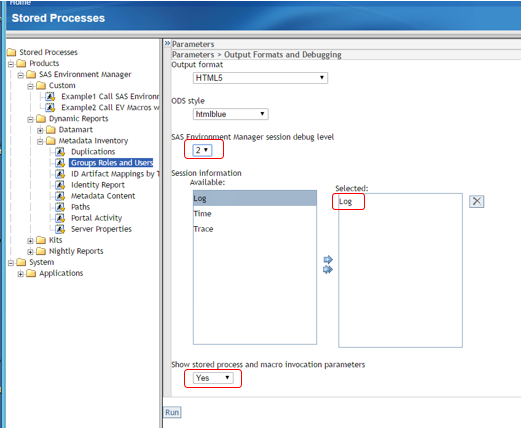
By browsing the SAS log and checking the called reporting macro and its parameters, you can quickly answer the four questions listed above.
If you know what data set you want to use but need to explore that data set further, there are two approaches:
- Try using the Ad-Hoc Reporting section as described above to explore the data sets.
- Use another data browsing tool–I’ve found that SAS Studio is perfect for this task.
When the Service Architecture Framework is initialized, the following data libraries are added to metadata automatically:
- SASEV – ACM
- SASEV – ARTIFACT
- SASEV – EVDM
- SASEV – KITS
For these cases you can just browse data directly using SAS Studio. For the other Data Mart libraries, (EVDB, EVDMRAW), you will have to first define those libnames and register the tables in metadata. Once this is done you can explore the data sets in exactly the same way.

1 Comment
Hi Naden,
When i am running the stored procedure of Metadata Audit, i am getting an error as " ERROR: File WORK.XAUDIT.DATA does not exist.". Please help me in debugging this .
Thanks & Regards,
Sandeep