While previous SAS releases provided high availability through custom-designed failover techniques, many customers requested more robust failover or cluster support for high availability. The SAS 9.4 Metadata Server cluster was introduced to help address this need.
A SAS Metadata Server cluster is a coordinated set of metadata servers that act as a single metadata server for a SAS software deployment. The metadata server cluster reduces single-point-of-failure concerns for the SAS Metadata Server. A clustered SAS Metadata Server keeps its data in sync, balances its workload, and continues to handle requests if a node fails – all while presenting a single face to the outside world.
Because the SAS Metadata Server supports all the SAS applications in your environment, it’s important to monitor the performance and availability of the servers in the cluster. In this blog post, I’ll share two different tools that you can use.
SAS Management Console
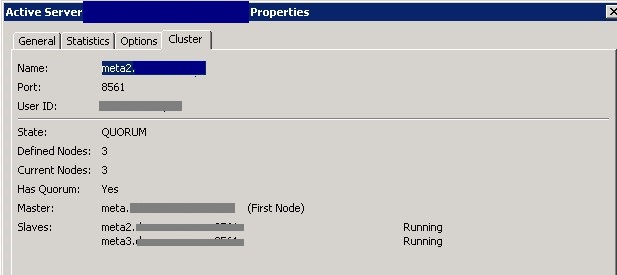
SAS Management Console enables you to view the overall status of a metadata server cluster and to individually monitor each node in the cluster. Additional functionality has been added to the Metadata Manager to display the overall status of the cluster, including the presence or absence of a quorum. Here’s a screenshot of the Cluster tab in Metadata Manager in SAS Management Console.
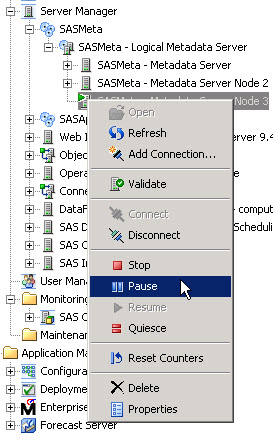
Individual nodes within the cluster can be viewed by using the Server Manager plug-in under SASMeta – Logical Metadata Server. By selecting a node in the cluster and connecting to it, you can control either the individual node or the entire cluster, depending on your selection.
SAS Environment Manager
SAS Environment Manager 2.3 provides the ability to display and monitor four SAS Metadata Server cluster-specific resources:
- Metadata Cluster Nodes Available
- Metadata Cluster Nodes Defined
- Metadata Cluster Percent Available
- Metadata Cluster Quorum Available
These resources are defined in the SAS Application Server Tier platform. This platform provides deployment-wide information such as license information and clustering. Note the addition of the “Metadata Clustered” field in the SAS 9.4 Application Server Tier.
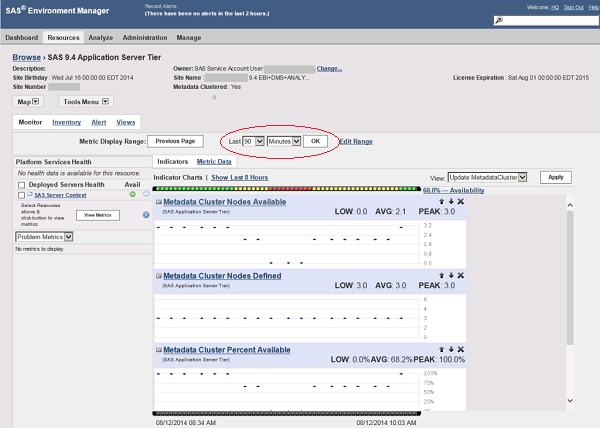
Resources can be displayed in a graphical or tabular format, as shown in the following screenshots. Let’s first look at the graphical format. All charts are displayed so that their time values align (X-axis), helping correlate activity between resources.
For illustration purposes, I’ve brought nodes in the cluster up and down to show what happens in SAS Environment Manager. The Metadata Cluster Nodes Available metric changes from 3 -> 2 -> 0 -> 2 -> 3. The availability bar at the top shows the availability of the resource during the time interval chosen (90 minutes in my example).
Note that the Metadata Cluster Nodes Defined metric remains constant at 3 because I didn’t add or remove nodes in the cluster, only brought nodes up and down.
The last metric, Metadata Cluster Quorum Available, is a binary indicator – either the cluster is in quorum (1) or not in quorum (0). For a more detailed explanation of quorum in SAS Metadata Server clusters, see How Metadata Server Clustering Works in the SAS 9.4 Intelligence Platform: System Administration Guide.
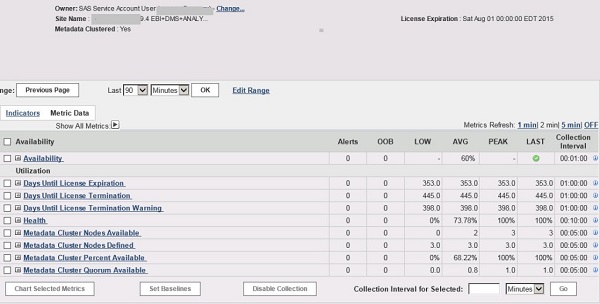
This information may also be displayed in a table by selecting Metric Data.
Finally, you may click on the title of the resource for a chart of that resource over the chosen timeframe. For example, here is a chart of the metric Metadata Cluster Percent Available.
These are the two methods I use to monitor SAS Metadata Server clusters, what methods do you use?


